Figures & data
Figure 1. Study area in Kanagawa prefecture.
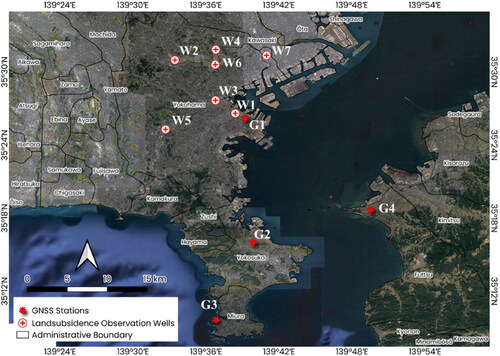
Table 1. Location data of GNSS control points used in the research (Nishi et al. Citation2021).
Table 2. Land subsidence observation wells in Yokohama city (Land subsidence Citation2022c).
Figure 2. Geology map in Kanagawa prefecture (Nishi et al. Citation2021).
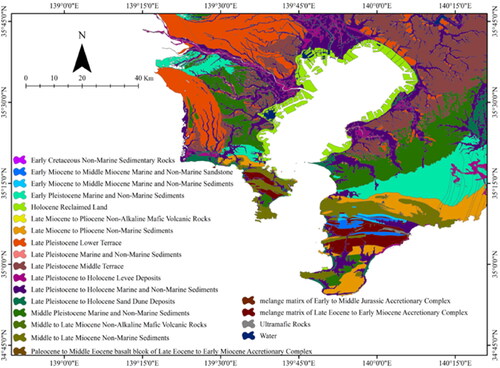
Figure 3. The rainfall intensity distribution in Yokohama city from 2017 to 2019 (Precipitation Citation2022).
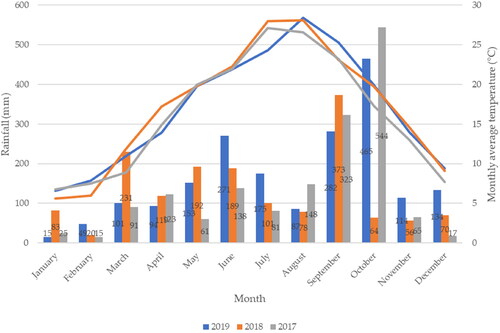
Table 3. Sentinel-1 C band data pairs (Nishi et al. Citation2021).
Figure 4. Illustration of land subsidence. Clay layers are being compressed (Modified (Tobita et al. Citation2004)).
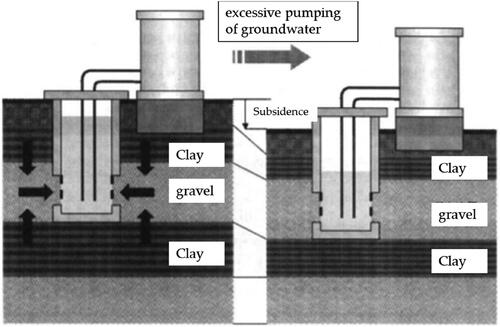
Figure 5. Flowchart of SARPROZ processing with APS removal.
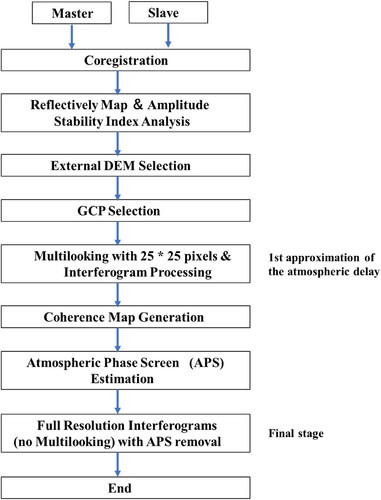
Figure 6. Land surface pressure and ground water model.
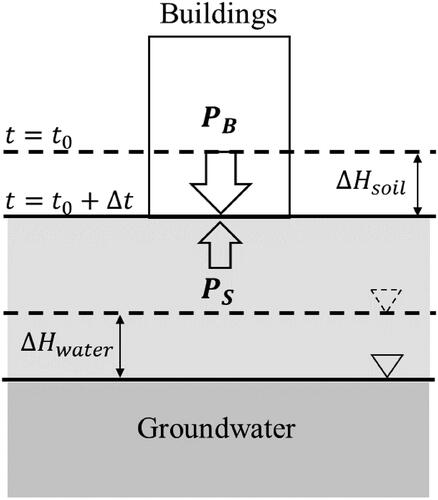
Figure 7. Examples of LOS displacement images.
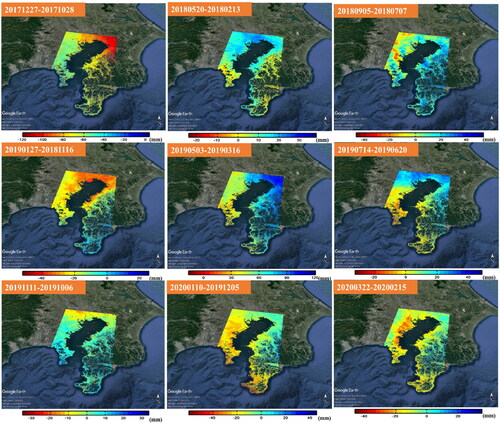
Table 4. Subsidence rate derived from Consecutive DInSAR and GNSS data.
Table 5. Subsidence rate derived from Consecutive DInSAR and Landsubsidence data.
Figure 8. Comparison of Consecutive DInSAR results and GNSS data in three cities.
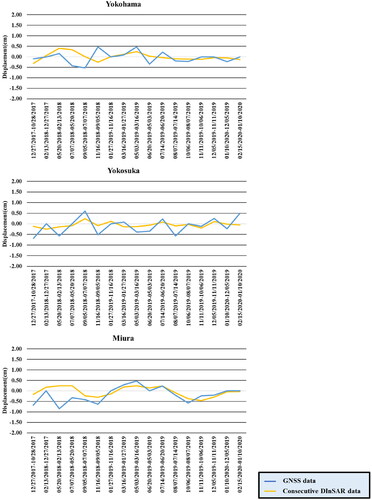
Figure 9. Correlation of Consecutive DInSAR results and land subsidence data (Yokohama Park).
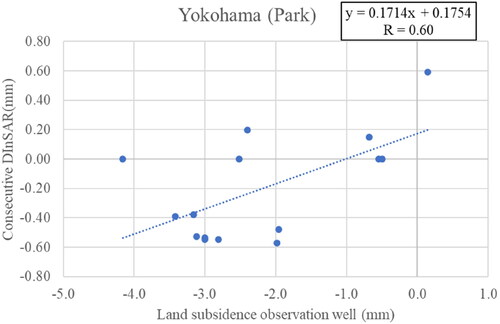
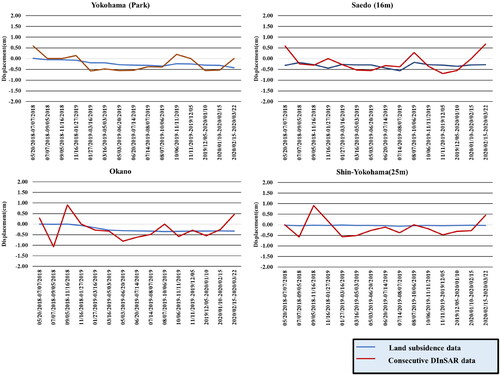
Figure 10. Examples of Consecutive DInSAR results and land subsidence data.