
Figures & data
Figure 1. Bengkayang’s coastal area with the 8 segments used for the shoreline analysis.
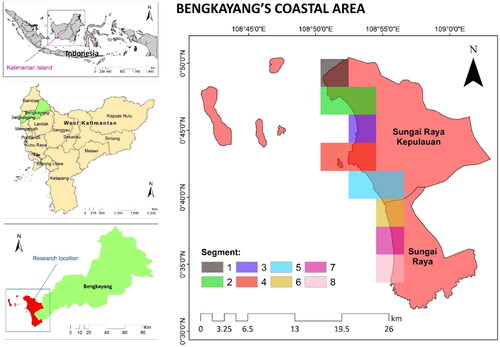
Table 1. Dataset and research variables.
Figure 2. Actual shoreline changes in Bengkayang Regency.

Figure 3. Shoreline changes in each segment measured as average and median values based on the baseline. The accretion is represented by positive values while abrasion is through negative values. Segments 1–4 showed accretion, but segments 6–7 had abrasions. Stable shorelines with a tendency to abrasion appeared in segments 1 and 5. Segment 8 occurred reversal from accretion to abrasion.
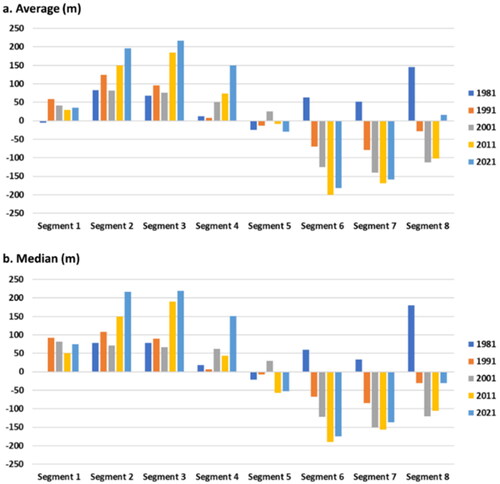
Table 2. Summary of shoreline changes from the baseline based on the buffering analysis.
Figure 4. Several factors proposed to be affecting the shoreline changes.
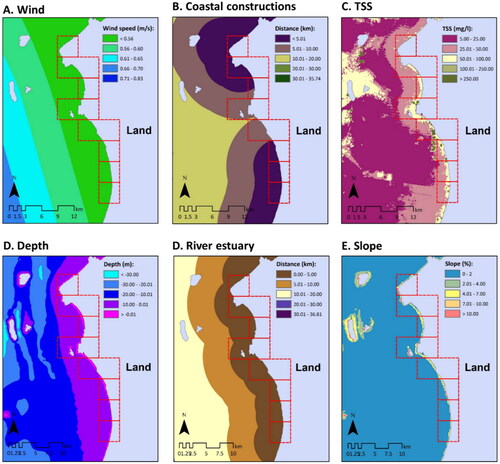
Table 3. Simultaneous interaction of factors affecting the shoreline changes in Bengkayang.
Table 4. Regression constant for the simultaneous interaction.
Table 5. Interaction of factors affecting the shoreline changes in each segment.
Table 6. Regression constant in segments 1–4.
Table 7. Regression constant in segments 5–8.
Figure 5. Potential shoreline changes in Bengkayang Regency.
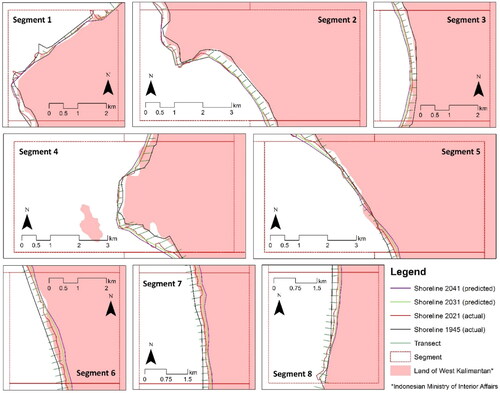
Table 8. Future shoreline changes in each segment of the Bengkayang Regency.
Figure 6. Detail of shoreline dynamics in each segment.
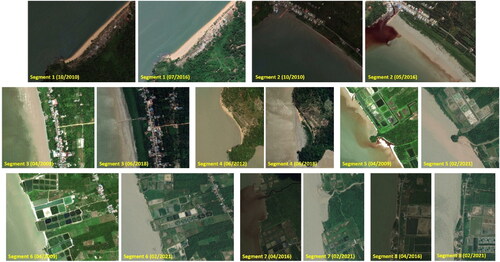
Table 9. Statistical parameters of shoreline changes.
Data availability
The datasets are available from the corresponding author on reasonable request.