
Figures & data
Figure 1. Study areas.
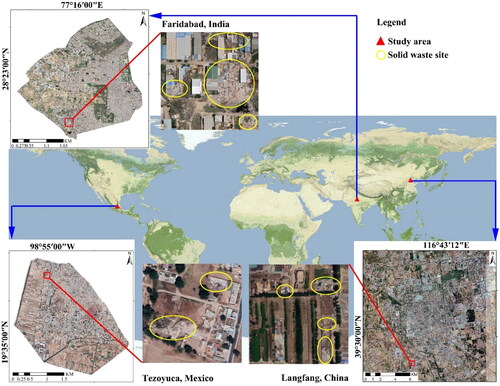
Figure 2. Samples of solid waste sites. (a) Langfang city in China; (b) Faridabad city in India; (c) Tezoyuca city in Mexico.
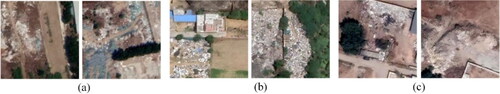
Table 1. Classification scheme.
Figure 3. Overall structure of the proposed SW-Net.
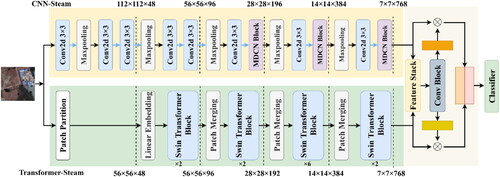
Figure 4. CNN stream.
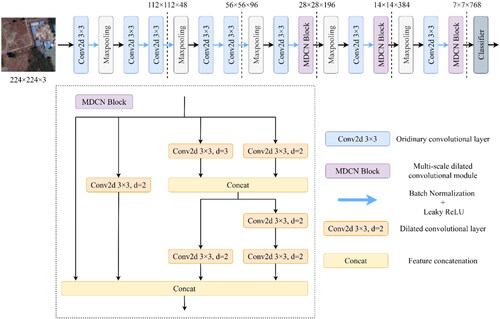
Figure 5. Transformer stream.
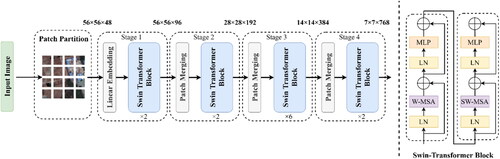
Figure 6. Gated fusion module.
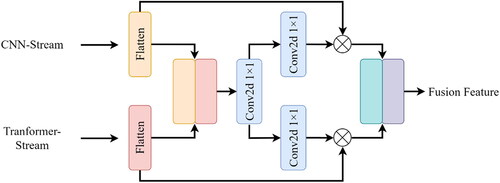
Figure 7. Boundary delineation of solid waste sites. (a) remote sensing image patch; (b) image patch overlayed with CAM; and (c) boundaries of solid waste sites generated by thresholding the CAM image.
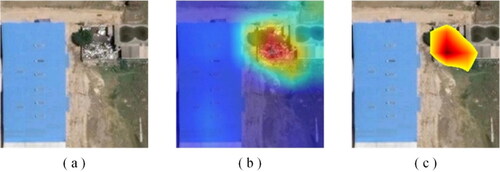
Figure 8. Mapping result of solid waste sites for (a) Langfang; (b) Faridabad; (c) Tezoyuca.
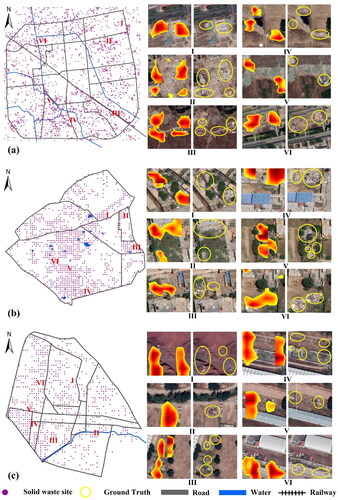
Figure 9. Confusion matrix of each study area. Notes. 0 represents non-solid waste sites and 1 denotes solid waste sites.
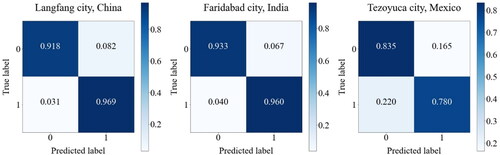
Figure 10. Examples of several predicted image patches. (a) solid waste sites predicted as non-solid waste sites; (b) non-solid waste sites predicted as solid waste sites.
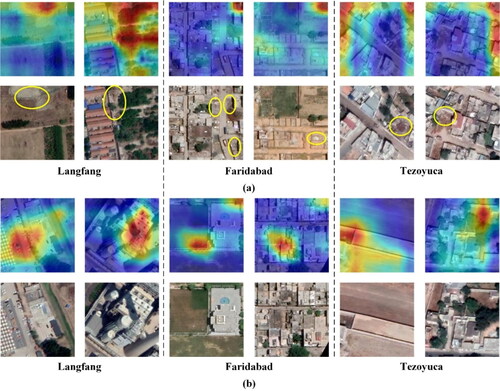
Figure 11. Exposure risk map for (a) Langfang; (b) Faridabad; (c) Tezoyuca.
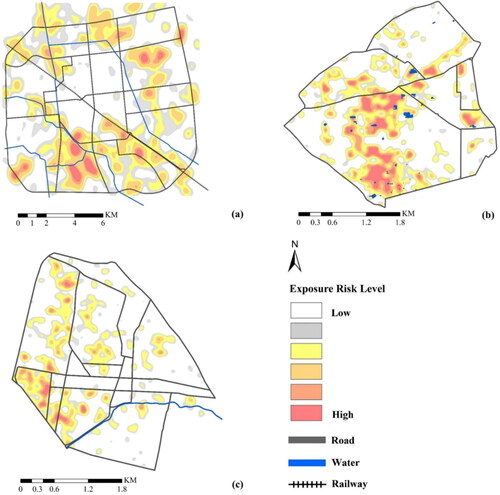
Table 2. Accuracy for CNN-only, Transformer-only and the proposed model.
Table 3. Comparison with other deep learning models.
Table 4. Comparison with other solid waste classification methods.
Data availability statement
The data & code that support the findings of this study are openly available at [https://github.com/MrSuperNiu/Remote-Sensing-for-Solid-Waste-mapping].