
Figures & data
Figure 1. Study area with groundwater sample sites and the land-use classes.
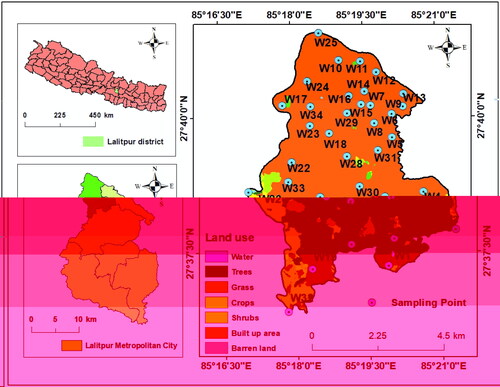
Figure 2. Geological map of Lalitpur Metropolitan City showing rock formations and groundwater sampling points.
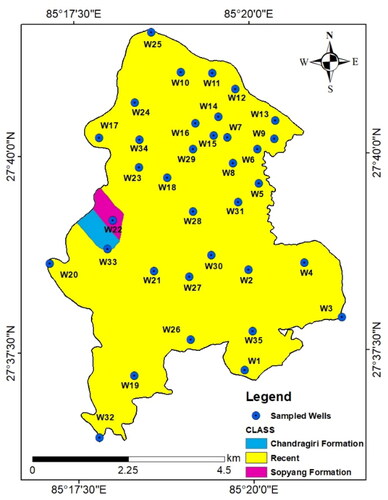
Table 1. Weights assigned to groundwater parameters for drinking purpose.
Table 2. Groundwater quality zoning for drinking through classification of weightage.
Table 3. Weights assigned to groundwater parameters for irrigation purpose.
Table 4. Groundwater quality zoning map for irrigation.
Table 5. Statistics of groundwater chemistry in Lalitpur Metropolitan City.
Table 6. Association among various chemical parameters in the groundwater of Lalitpur Metropolitan City in Winter and Post-monsoon as revealed by the Pearson moment correlation coefficient.
Figure 3. Spatial distribution map of pH of study area.
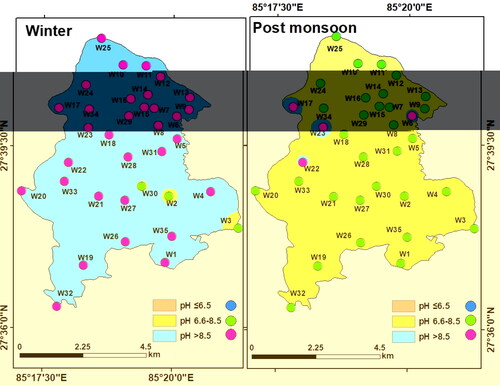
Figure 4. Spatial distribution map of Total Dissolved Solids of study area.
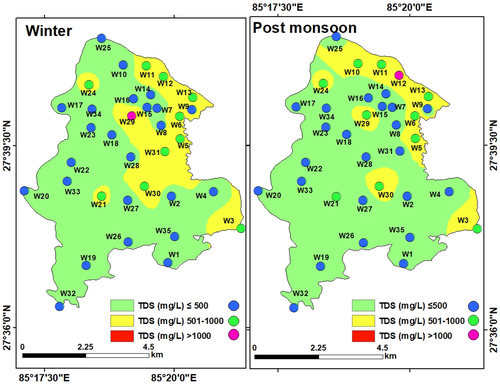
Figure 5. Spatial distribution map of Electrical Conductivity of study area.
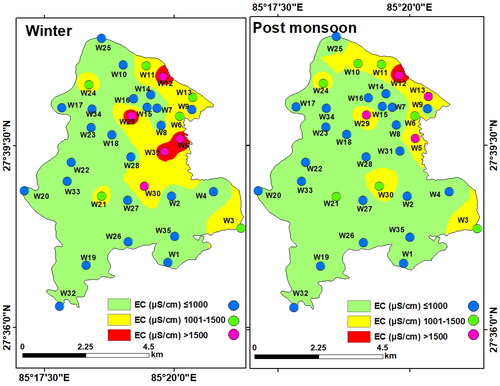
Figure 6. Spatial distribution map of Total Hardness of study area.
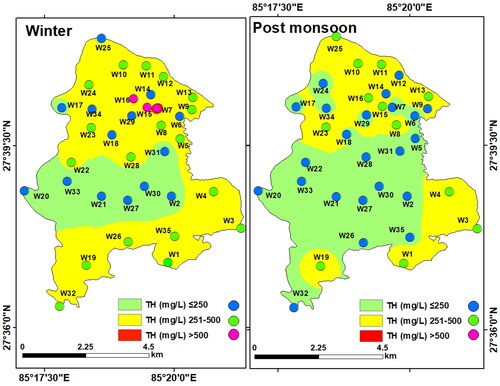
Figure 7. Spatial distribution map of Calcium ion of study area.
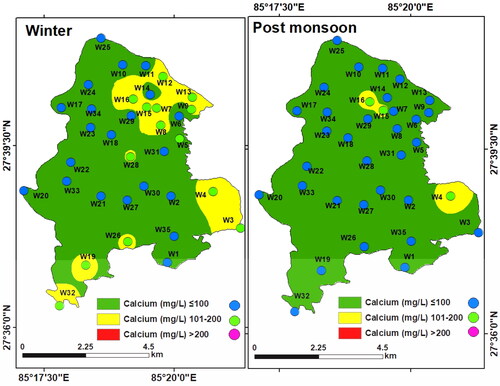
Figure 8. Spatial distribution map of Magnesium ion of study area.
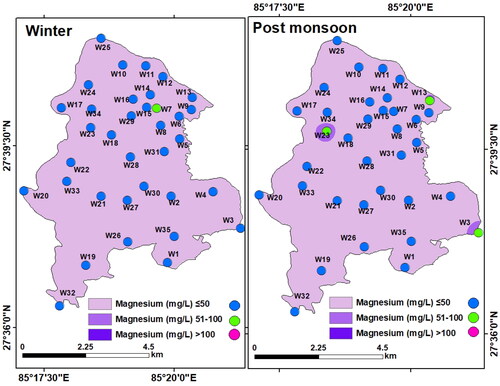
Figure 9. Spatial distribution map of Sodium of study area.
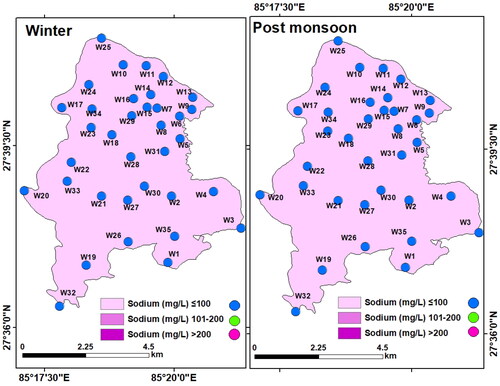
Figure 10. Spatial distribution map of Potassium of study area.
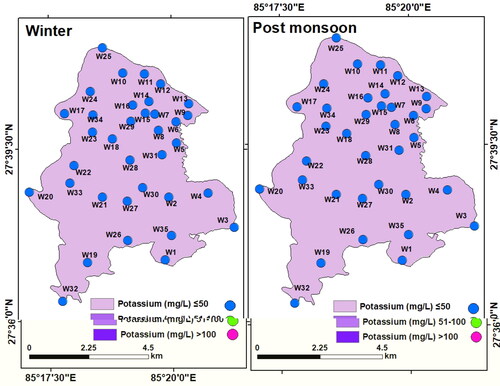
Figure 11. Spatial distribution map of Ammonium in LMC.
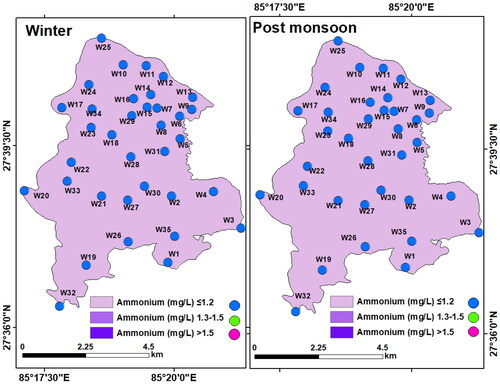
Figure 12. Spatial distribution of Bicarbonate in the groundwater of LMC.
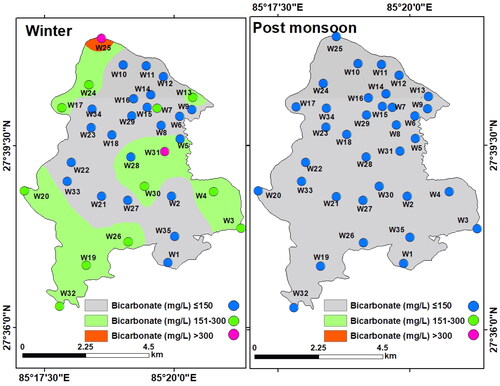
Figure 13. Spatial distribution of Chloride in the groundwater of LMC.
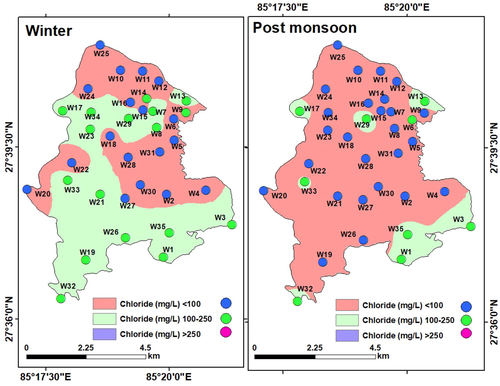
Figure 14. Spatial distribution of Sulphate in the groundwater of LMC.
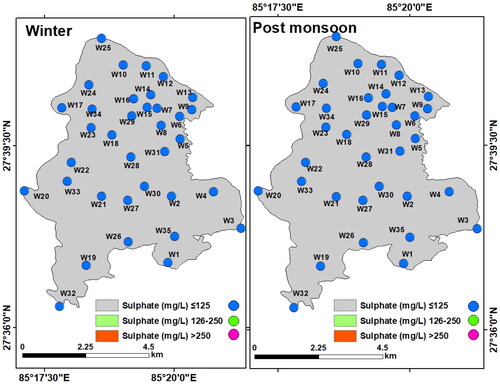
Figure 15. Spatial variation of Nitrate in the groundwater of LMC.
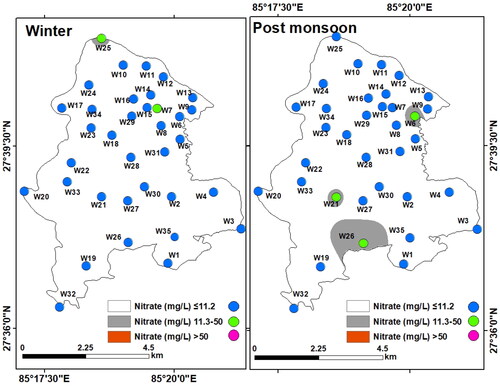
Figure 16. Spatial distribution map of Phosphate of study area.
Figure 17. Spatial variation of Iron in the groundwater of LMC.
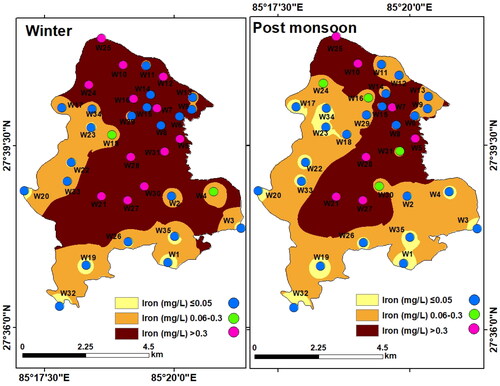
Figure 18. Spatial distribution of total coliform in the groundwater of LMC.
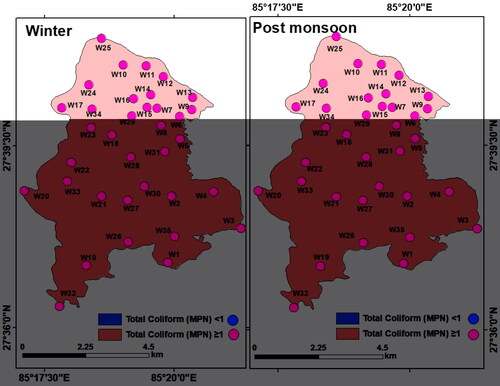
Figure 19. Groundwater quality for drinking in the municipality wards of LMC with population density.
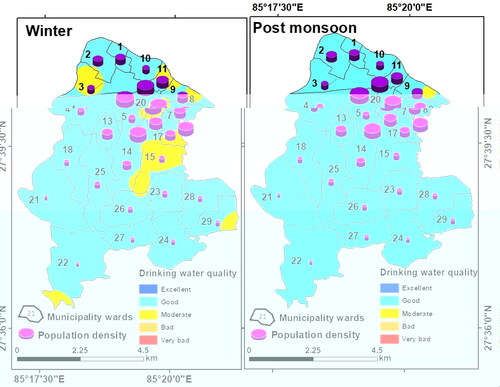
Figure 20. Spatial and seasonal variations of contamination level in the groundwater at the sampling sites (wells).
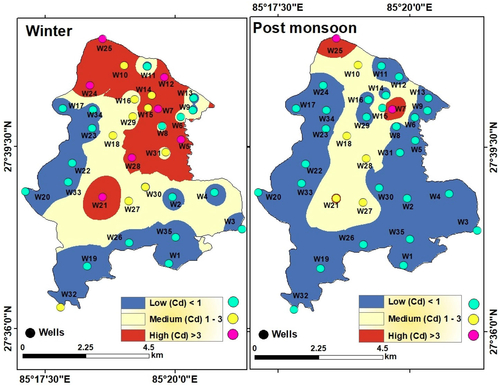
Table 7. Contamination level (C-level) of groundwater in the municipality wards of Lalitpur Metropolitan City during winter and post-monsoon as determined by the contamination index (Cd).
Figure 21. A: Groundwater contamination level and population density in the municipality wards of LMC. B. Ward wise total population in the LMC.
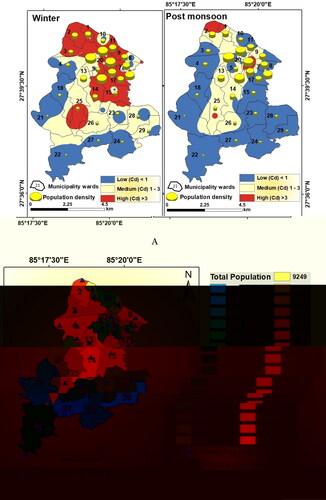
Table 8. Municipality ward-wise projected population of Lalitpur Metropolitan City in the year 2021 (based on population growth rate in Nepal by the World Bank).
Figure 22. Groundwater quality of samples for irrigation based on TDS concentration.
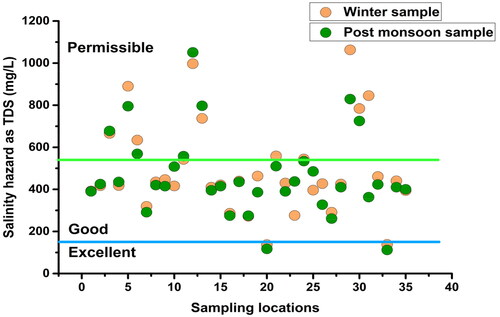
Figure 23. Groundwater quality for irrigation based on chloride concentration.
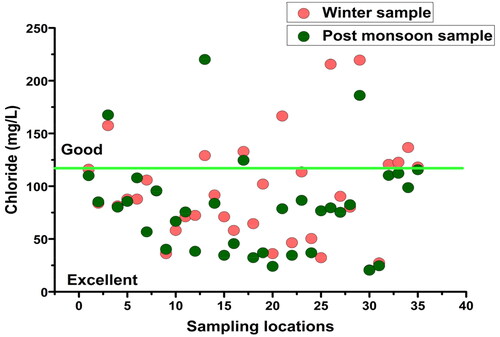
Figure 24. Sodium Adsorption Ratio (SAR) in winter and post-monsoon samples.
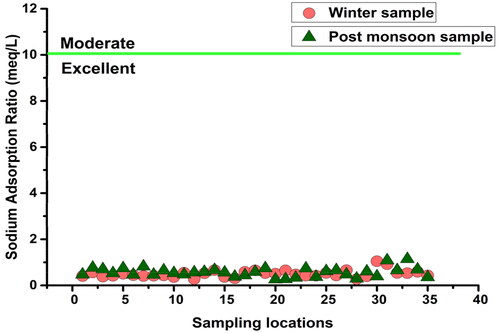
Figure 25. Spatial distribution map of Sodium percentage.
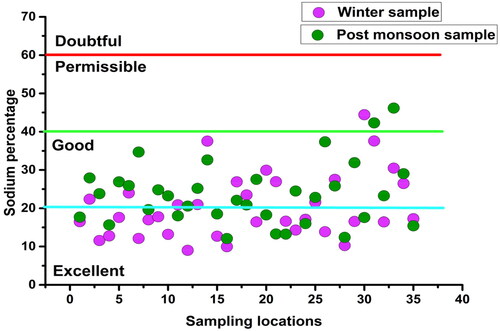
Figure 26. Spatial distribution map of Permeability Index.
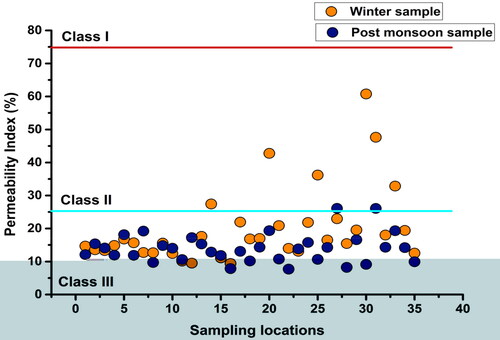
Figure 27. Magnesium Adsorption Ratio (MAR) in winter and post-monsoon samples.

Figure 28. Groundwater quality for irrigation in the municipality wards of LMC.
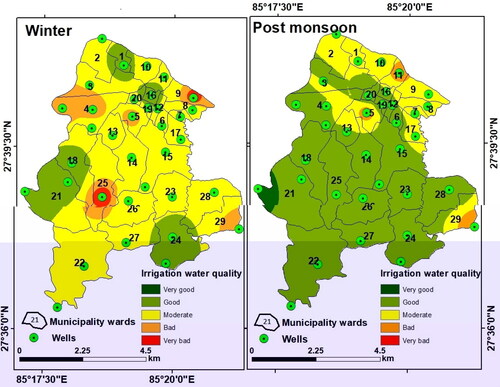
Figure 29. Scatter plots showing variations of the principal cations versus TDS in winter (a), and during the post-monsoon (b).
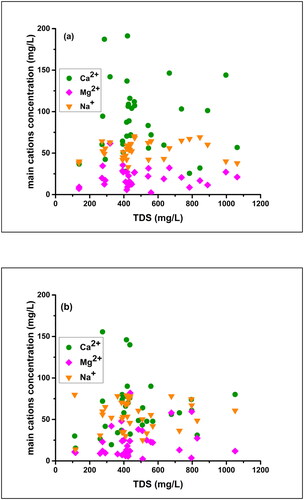
Figure 30. Scatter plots showing variations of the principal anions versus TDS in winter (a), and during the post-monsoon (b).
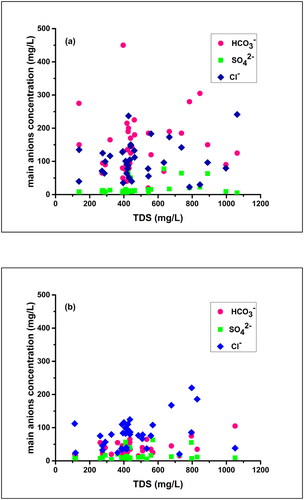
Figure 31. Scatter plot showing seasonal variation of Na+ versus Clˉ in the groundwater.
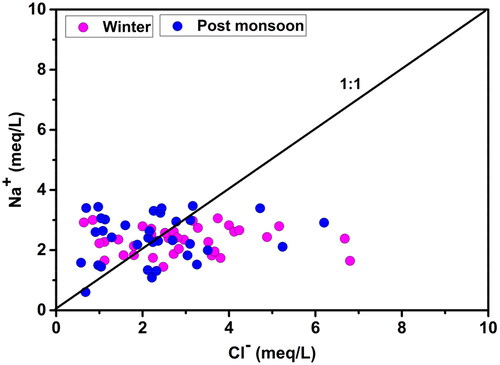
Figure 32. Scatter plot for seasonal variation of HCO3ˉ versus Na+ in the groundwater.
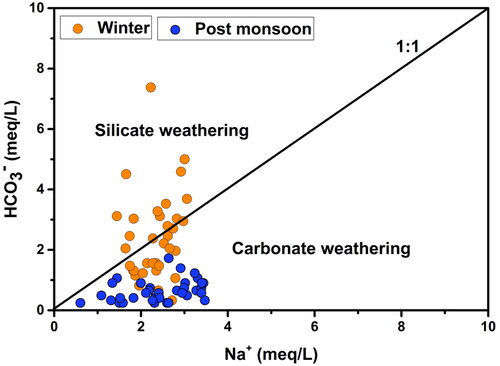
Figure 33. Scatter plot showing seasonal variation of Ca/Mg molar ratio.
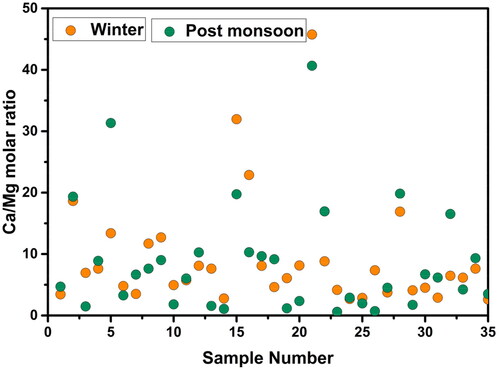
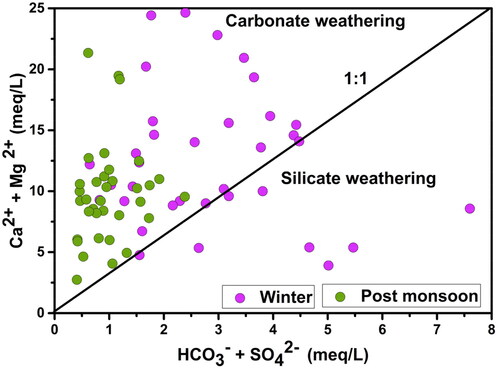
Figure 34. Scatter plot of (Ca2+ + Mg2+) versus (HCO3ˉ + SO42ˉ) depicting seasonal variation in silicate weathering and carbonate weathering.
Data availability statement
All the datasets used to support the findings of this study are available from the corresponding author upon request.