Figures & data
Table 1. Definition and classification of river patterns.
Figure 1. Map of the geographical location of the study area. (a) Geographical location of the Yellow River in China, downloaded from the Ministry of Natural Resources of the people’s Republic of China (www.mnr.gov.cn/sj/sjfw) (b) DEM and main reservoirs in the Yellow River Basin. Abbreviations include Longyangxia (LYX), Liujiaxia (LJX), Qingtongxia (QTX), Wanjiazhai (WJZ), Sanmenxia (SMX), and XLD. (c) Detailed map of the LYR, including main hydrological stations and XLD Dam. Abbreviations include Huayuankou (HYK), Gaocun (GC), Taochengpu (TCP), Aishan (AS), and Lijin (LJ).
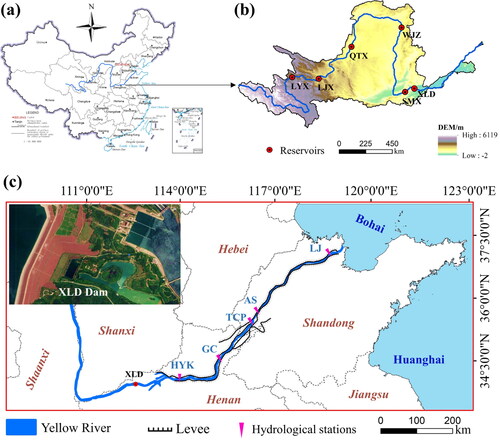
Figure 2. Flowchart of the method in this paper.
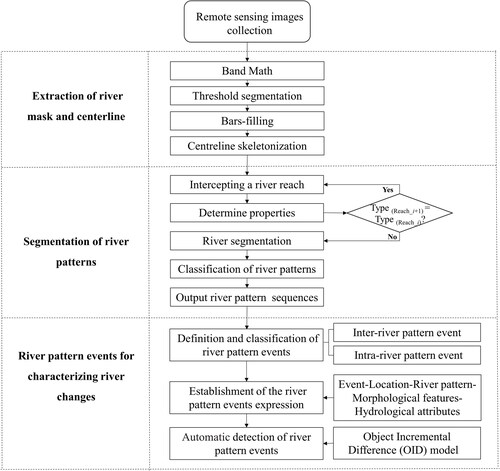
Figure 3. Schematic diagram of river mask and centreline extraction from Landsat images.
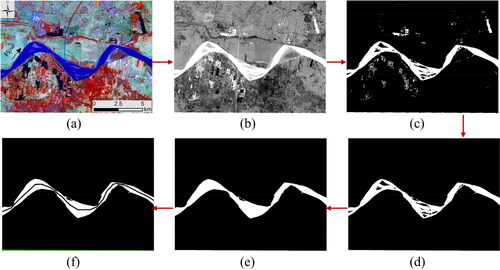
Figure 4. Schematic diagram of river pattern sequences. S, M, A, B are the abbreviations for straight, meandering, anabranched, and braided, respectively.
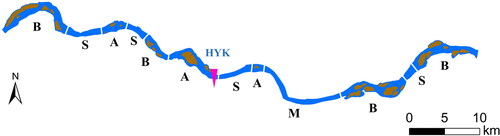
Figure 5. The relationship of five-dimensional information in the RPEM model.
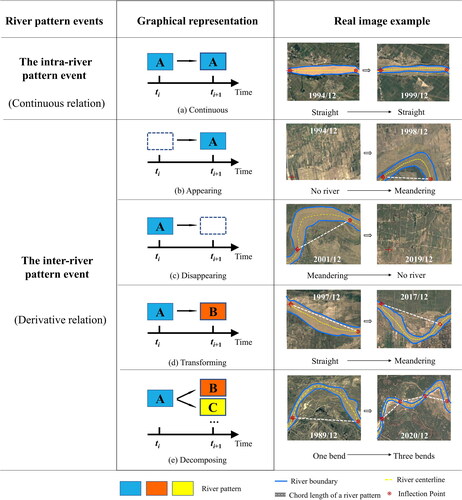
Figure 6. Classification scheme of river pattern events.
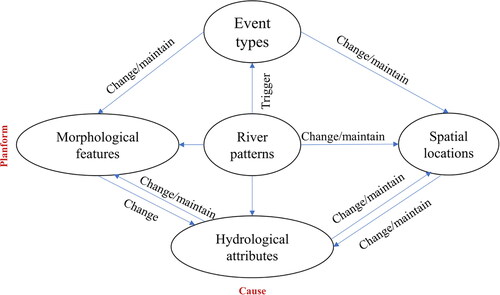
Figure 7. Schematic diagram of river pattern event detection and discovery. (a) The corresponding relationship between the sequences of river pattern units at two moments; (b) Example diagram.
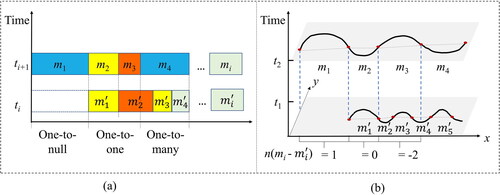
Figure 8. Schematic diagram of river pattern event sequence.
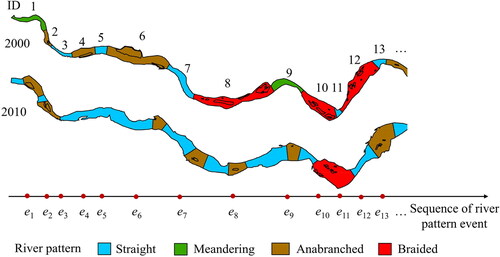
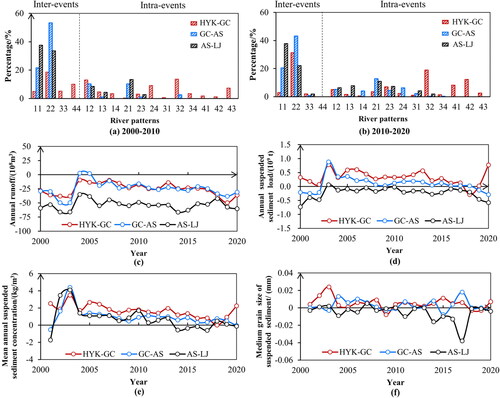
Figure 9. Spatio-temporal distribution and statistics of river pattern events in 2000, 2010, and 2020. Inter-river pattern events in the legend are indicated by 0. Intra-river pattern events include four cases, 1, 2, 3, ≥4, respectively, represent that an individual river pattern at t2 is translated from 1, 2, 3, ≥4 river patterns at ti, e.g. 3 refers to the number of river patterns at t(i+1).
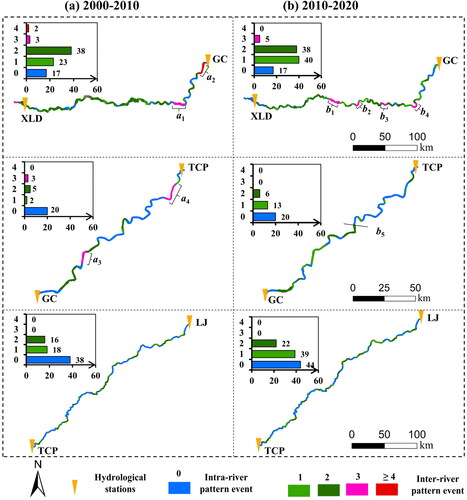
Figure 10. Changes of river patterns at typical hydrological stations.
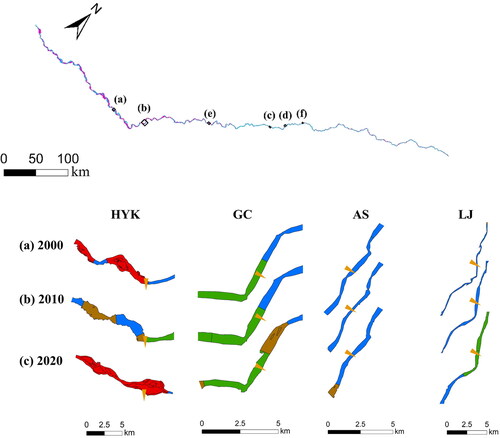
Table 2. Information extraction and output of river pattern events of four hydrological stations on the LYR (2000–2020).
Table 3. Comparison of methods for expressing river changes.
Figure 11. Statistics of river pattern events on the LYR and hydrological properties in the RPEM model. (a) and (b) are the transition matrices between the four river patterns, where 1, 2, 3, and 4 represent four river patterns: straight, meandering, anabranched and braided.