Figures & data
Figure 1. Spatial distribution of Air Quality Control Stations in Tehran, roads, and built area.
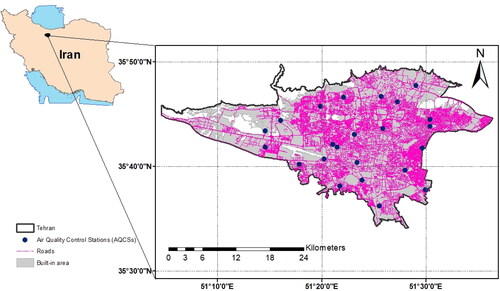
Figure 2. A flowchart showing the research process.
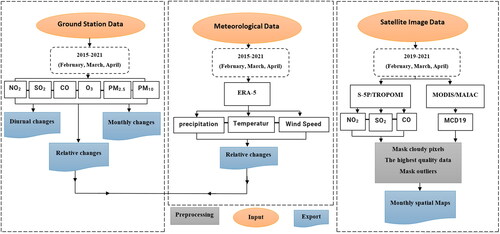
Figure 3. Diurnal variations of ambient air pollutants concentrations (a–f): NO2, O3, CO, SO2, PM10, and PM2.5 respectively, during February to April in 2020,2021, and long-term average in 2015–2021: blue, red, and yellow lines respectively.
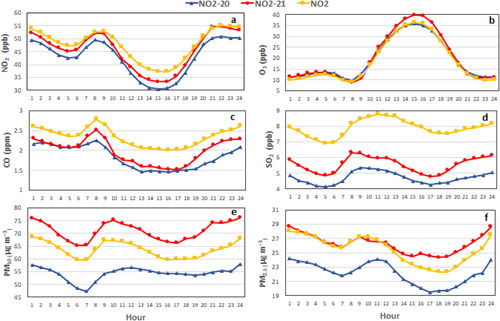
Figure 4. Monthly variations of ambient air pollutant concentrations (a–g): NO2, CO, SO2, PM2.5, PM10, PM2.5/PM10, and O3 respectively, from February to April 2020,2021, and long-term average in 2015–2021: blue, red, and yellow boxes respectively.
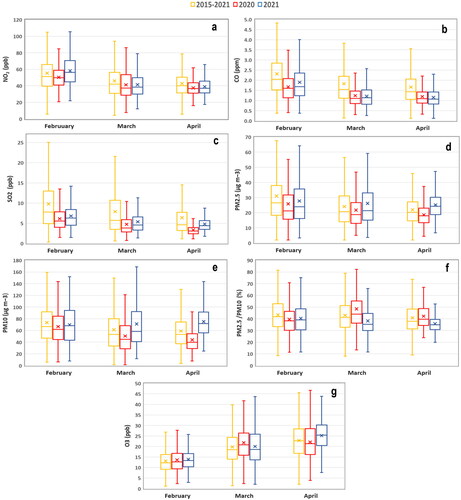
Table 1. T-test results of air pollutants concentrations in 2020 and 2021 during lockdown (February–April) to the same period over seven years (2015–2021).
Table 2. T-test result of meteorological data in 2020 and 2021 during lockdown (February–April) to the average of the same period over seven years (2015–2021).
Table 3. Changes in period mean (February–April) air pollutant concentrations in 2020 and 2021 during lockdown to the same period’s average over seven years (2015–2021).
Table 4. Changes in period mean (February–April) meteorological parameters in 2020 and 2021 during lockdown to the average of the same period over seven years (2015–2021).
Figure 5. Spatial distribution of tropospheric NO2 during February–April from 2019–2021 and difference maps with 2019.
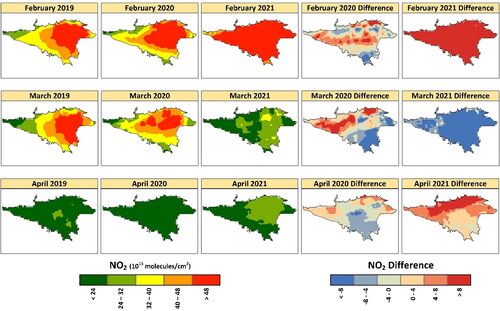
Figure 6. Spatial distribution of tropospheric CO column density during February–April from 2019- 2021 and difference maps with 2019.
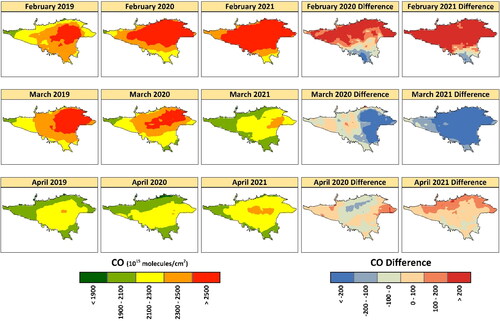
Figure 7. Spatial distribution of SO2 column density during February – April from 2019- 2021 and difference maps with 2019.
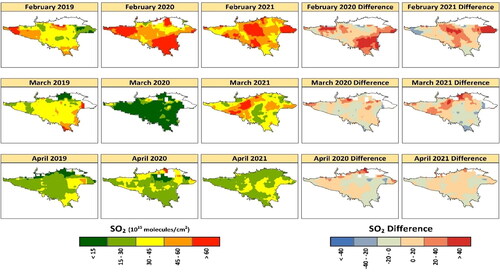
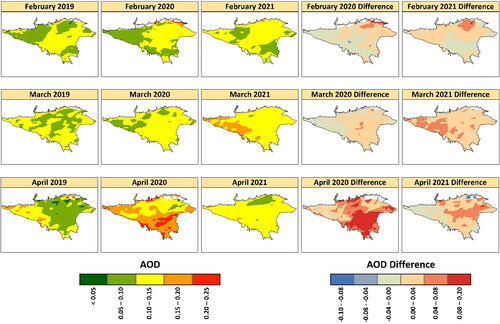
Figure 8. Spatial distribution of MAIAC AOD at 550 nm during February – April from 2019- 2021 and difference maps with 2019.