
Figures & data
Figure 1. The general location of the study area is shown in the first box of the image, it is a pond fed by a spring submerged in the bottom. The second box on the right shows an aerial view of the pond in more detail from an image taken from the UAV.
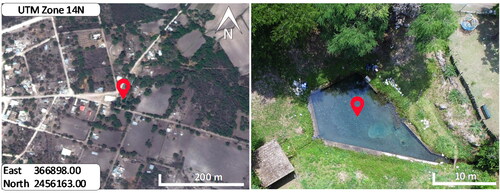
Figure 2. Tests in a controlled environment: a) laboratory test, b) trawling platform, c) aquatic environment test aquarium.
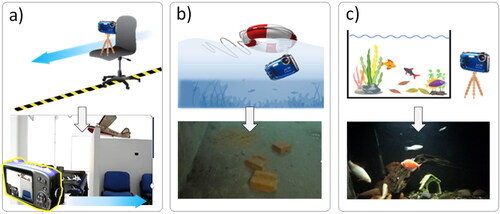
Figure 3. Non-georeferenced data acquisition and sequence image generation.
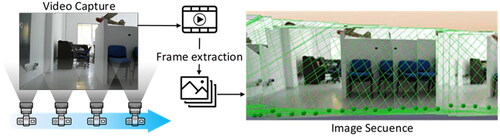
Figure 4. Experiment approach to segment moving objects from background objects. Experiment 1: controlled environment, fish tank, Experiment 2: real environment–small lake.
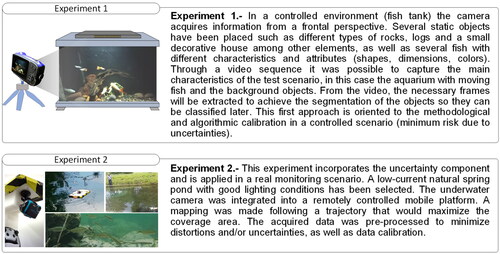
Figure 5. General workflow chart, starting with the reading and matching of the input data, continuing with the data processing, followed by the object segmentation process and ending with the moving object detection process.
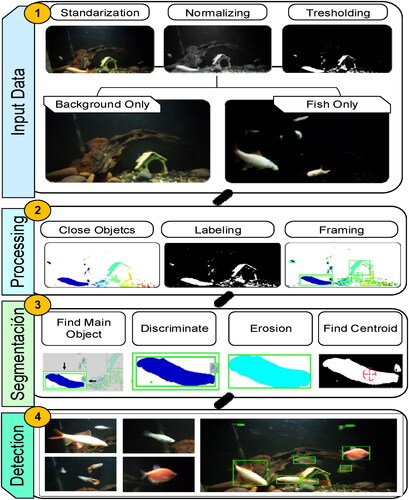
Figure 6. Proposed methodological scheme for the fusion of heterogeneous and multiplatform information.
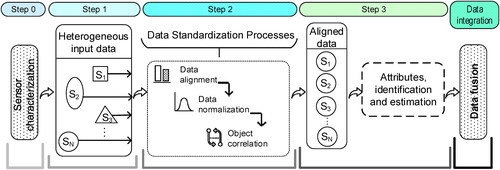
Figure 7. Comparative table of methodologies used in the study. In the centre there is a representation of the application scenario and the different stages of each method associated to its respective UAV-USV platform.
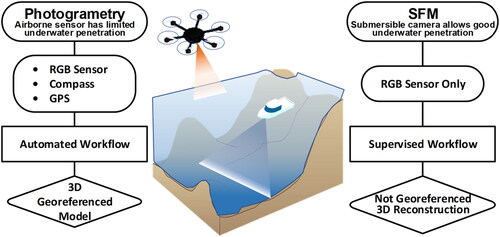
Figure 8. The first row shows the main characteristics of the XP90 submersible sensor, then a simplified diagram of the main characteristics of the remote platform and the sensor, the model and characteristics of the sensor mounted on the UAV are shown in the last row of the diagram.
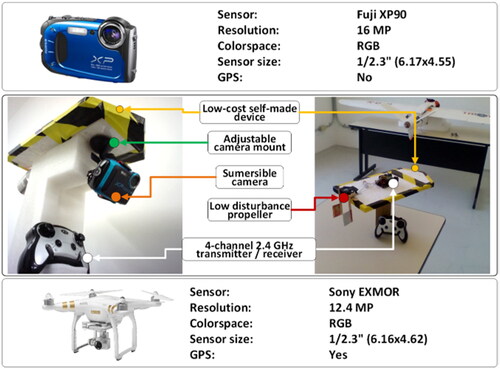
Figure 9. The platform can produce alterations in the water surface distorting the image obtained and the suspended matter can generate anomalies in the captures or completely obstruct the vision of the sensor.
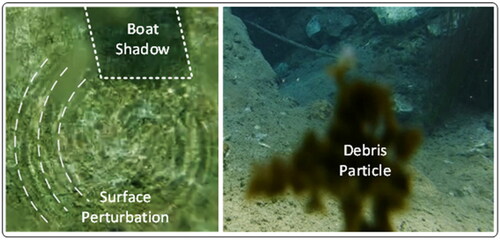
Figure 10. Table contrasting the results of the 3D reconstruction in relation to the workflow used for the 3D reconstruction (supervised and unsupervised) and to the platform used (UAV-USV).
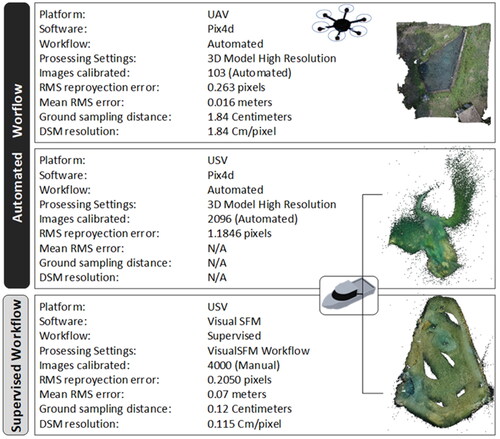
Figure 11. Upper view of the study area and geometric path calculated from supervised SFM, in a) the result of the point cloud obtained is shown, in b) the path reconstructed from the resulting cloud is shown, the digital terrain model is shown in c) and the digital elevation model in d).
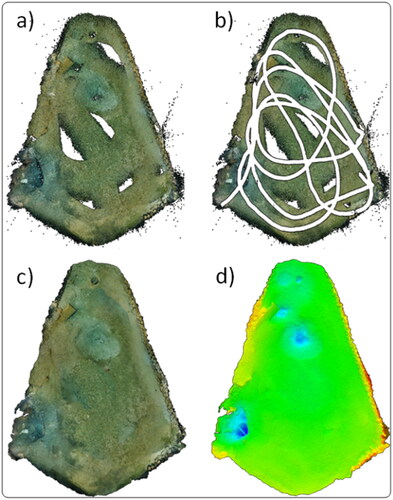
Figure 12. Comparison between UAV and USV point clouds. The scale indicates the absolute relative distances found between the two point clouds.
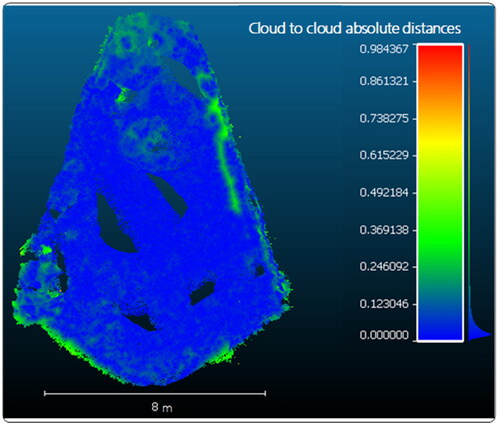
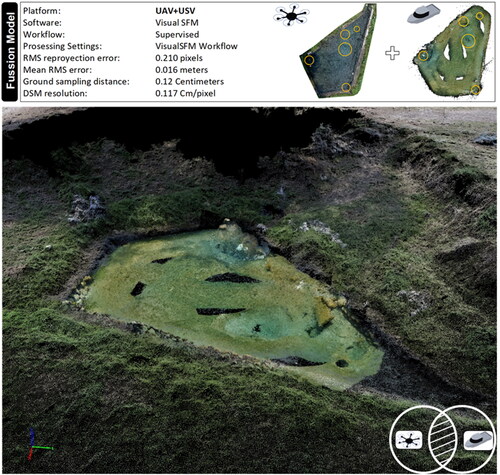
Figure 13. 3D reconstruction of data fusion from the platform used (UAV-USV).
Data availability statement
The data supporting this study’s findings are available from the corresponding author, upon reasonable request.