
Figures & data
Figure 1. The study area Iraq.
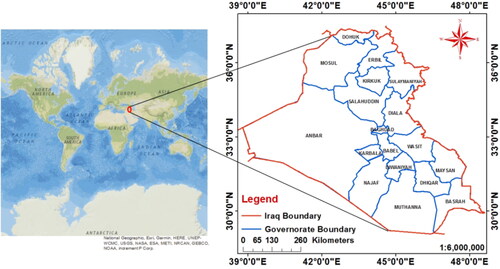
Table 1. Remotely sensed data properties.
Figure 2. The workflow.
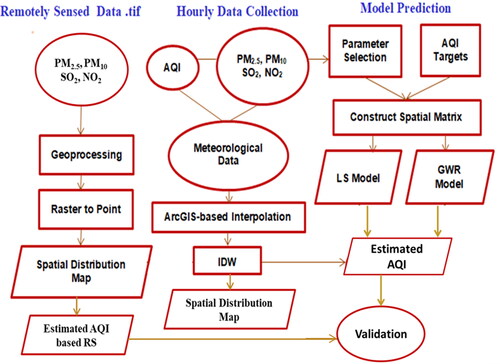
Figure 3. Ground stations.
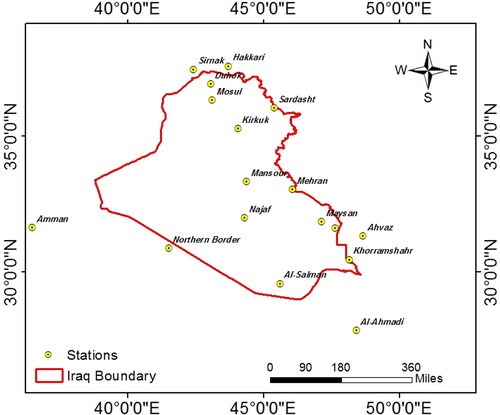
Figure 4. Spatial Distribution Maps of PM2.5 (a), SO2 (b), and (c) NO2.
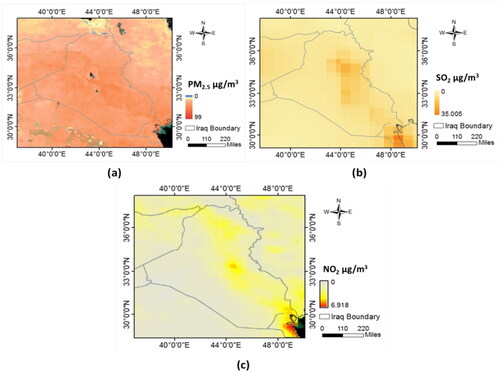
Figure 5. Spatial distribution of the air quality, PM2.5, and PM10 in Iraq.
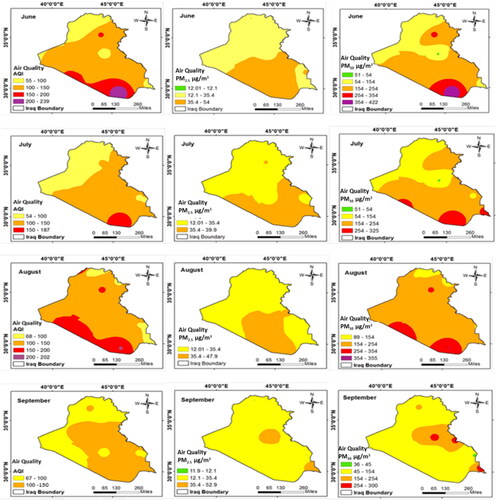
Table 2. AQI breakpoints.
Figure 6. Spatio-temporal variation in temperature and humidity in Iraq (June to September 2020).
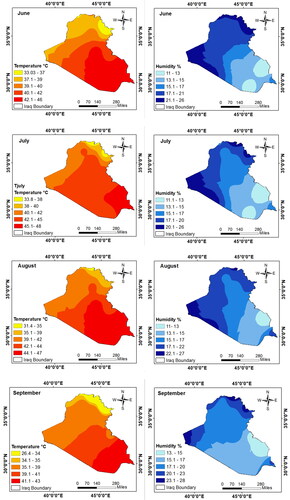
Figure 7. LS cross-validation.
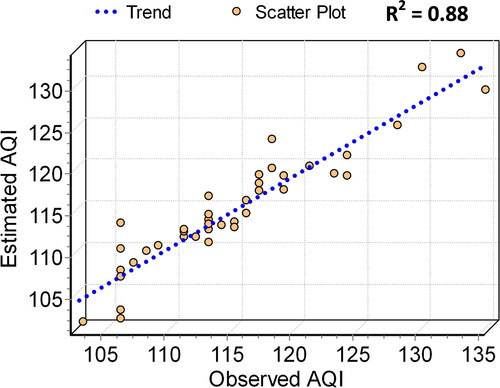
Table 3. Descriptive statistics generated by the LS model using hourly data.
Figure 8. GWR cross-validation.
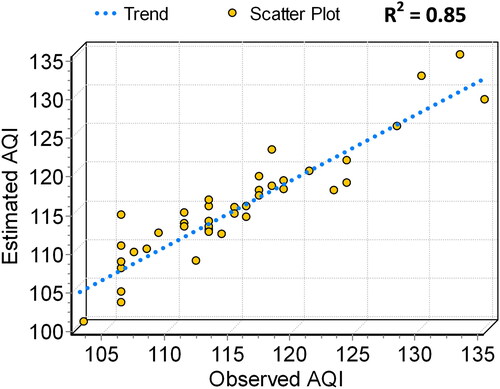
Table 4. Descriptive statistics generated by the GWR model using hourly data.
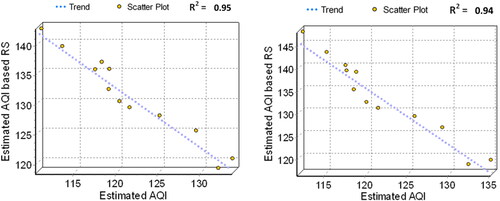
Figure 9. Accuracy evaluation of; (a) LS model, and (b) GWR model.
Data availability statement
The data used in this study are obtained from online sources via links; https://air-quality.com/country/iraq/6296425d?lang=en&standard=aqi_us, and https://go.nasa.gov/3zb30zr.