Figures & data
Figure 1. Location map of the study area (i.e. Nandhaur Landscape). Field inventory plots location are overlaid on false colour composite of Sentinel-2 (R: NIR, G: Red, B: Green) image dated 8th December, 2018.
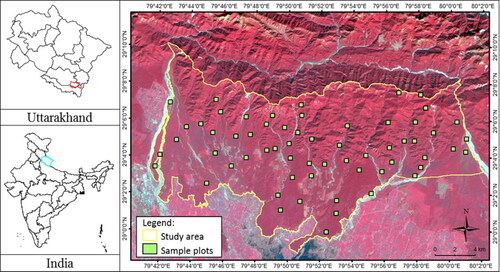
Figure 2. Ombrothermic diagram of mean temperature and monthly rainfall of the study area (Source: Eddy Covariance Flux Tower Site, Haldwani-http://asiaflux.net/index.php?page_id=61).
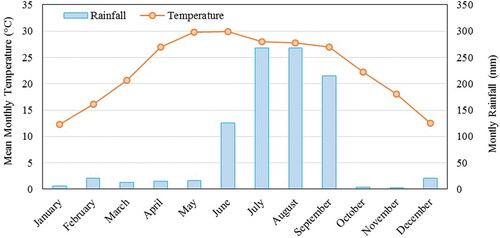
Figure 3. Asynchrony in phenological phases of the dominant trees (Dominance based on Important Value Index (IVI)) of different forest type.
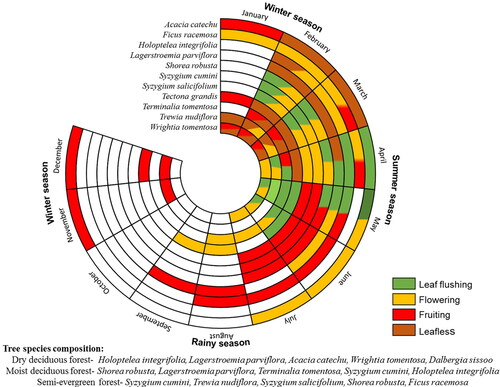
Table 1. Sentinel-2 datasets used in the study.
Table 2. Variation in tree species diversity and richness of each forest type and IVI of dominant species.
Figure 4. Temporal variation of R2 between tree diversity (H') and Rao’s Q index based on NDVI for different forest types and the overall landscape (all forest type combined) over the year.
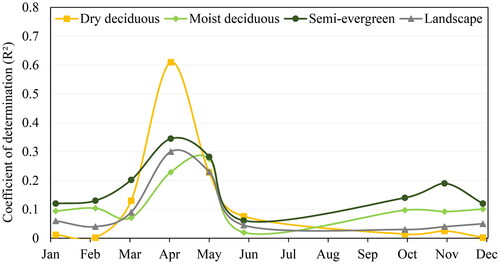
Table 3. NDVI based Multi-temporal SVH models developed for different types.
Figure 5. Relation between tree diversity (H') and NDVI derived multi-dimensional Rao’s Q index for Dry deciduous forest.
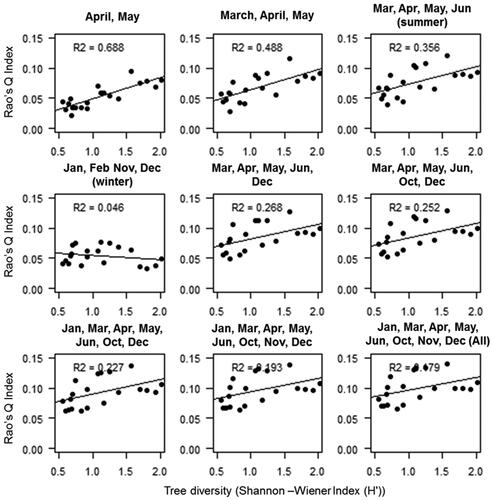
Figure 6. Relation between tree diversity (H') and NDVI derived multi-dimensional Rao’s Q index for Moist deciduous forest.
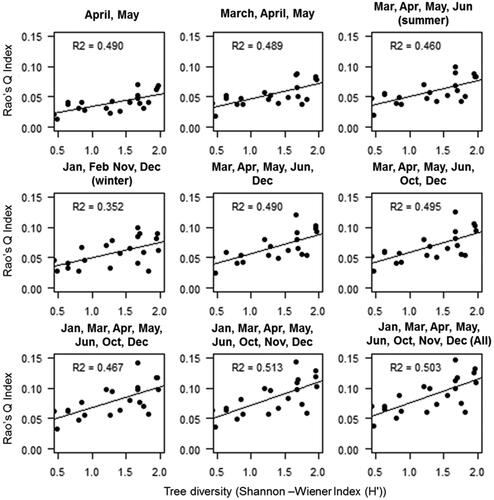
Figure 7. Relation between tree diversity (H') and NDVI derived multi-dimensional Rao’s Q index for Semi-evergreen forest.
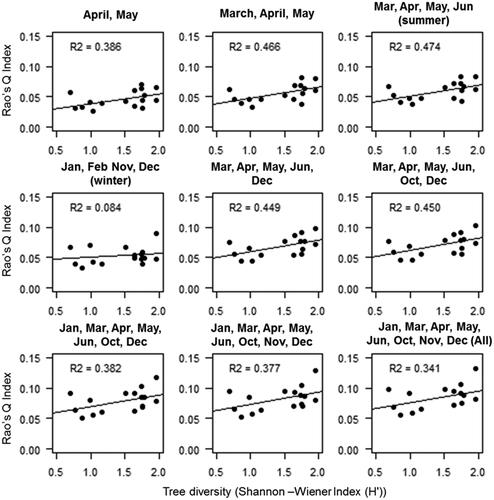
Figure 8. Relation of tree diversity (H') and Rao’s Q index derived from NDVI with Moisture Stress Index (MSI) of Sentinel-2 (22 April, 2018 for dry- & moist deciduous and 7 May, 2018 for Semi-evergreen forest).
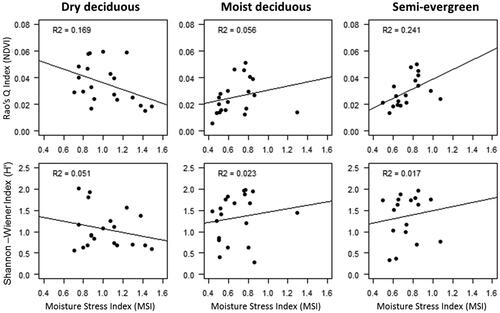
Figure 9. Annual trend of NDVI computed from Sentinel-2 for different forest types.
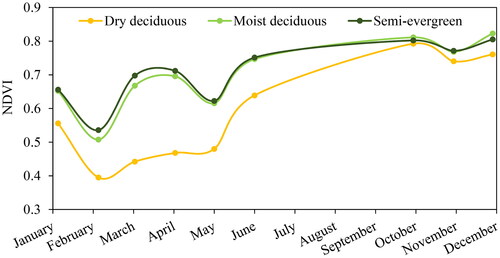
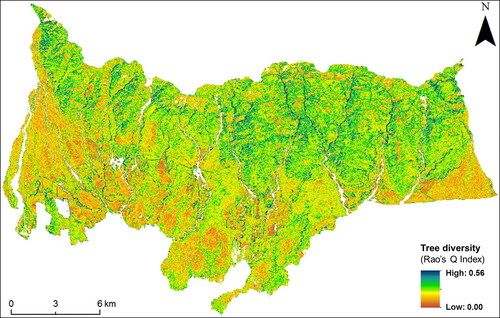
Figure 10. Composite Rao’s Q index-based tree diversity map at 0.1 ha scale derived from multi-date NDVI.