
Figures & data
Figure 1. Geographical locations of selected stations.
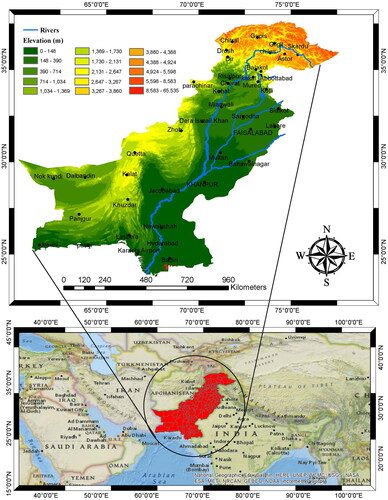
Figure 2. Framework for the application of binary panel data models.
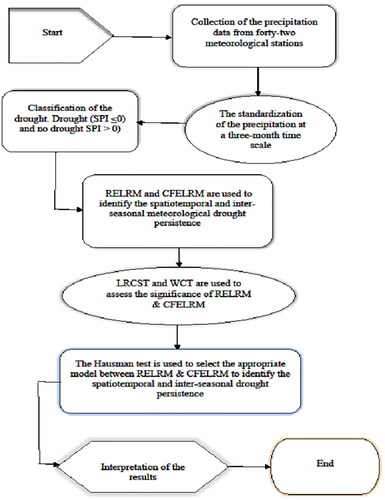
Figure 3. Mean and standard deviation for selected geographical stations.
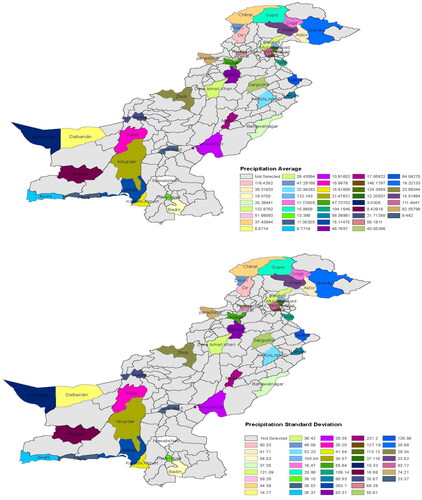
Figure 4. Theoretical vs. empirical distributions on several stations. The results of several stations are presented. However, the theoretical vs. empirical distributions on other stations can be observed accordingly.
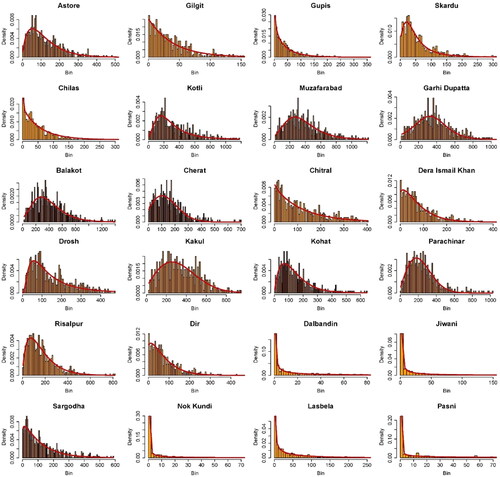
Figure 5. The temporal behaviour of SPI-3 on varying stations. The specific stations are presented, however, the temporal behaviour of SPI-3 other selected stations can be observed accordingly.
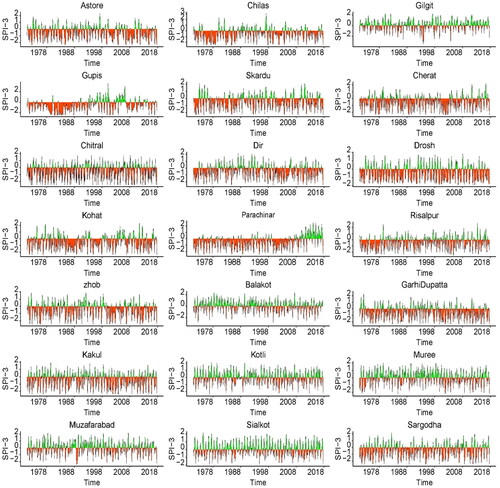
Figure 6. Temporal behaviour of SPI-3 ≤ 0 in various stations. The maximum and minimum drought for each year is provided. For instance, the maximum and minimum drought occurred in Astore is 12 and 5, respectively, from January 1971 to December 2017.
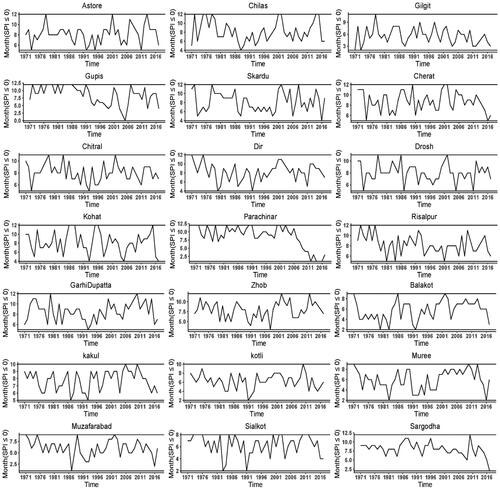
Table 1. Climatological characteristics of the precipitation are given for the various stations.
Table 2. The various probability distributions and their BIC are given.
Figure 7. The latitude and longitude of the selected stations and their monthly average drought for SPI-3 < 0 in selected time period.
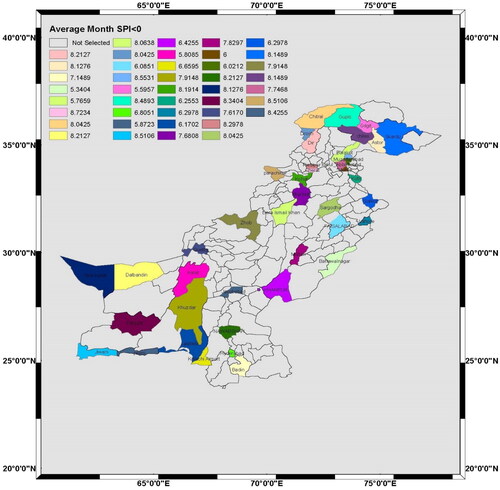
Figure 8. The total number of counts with SPI-3 ≤ 0 in the selected stations.
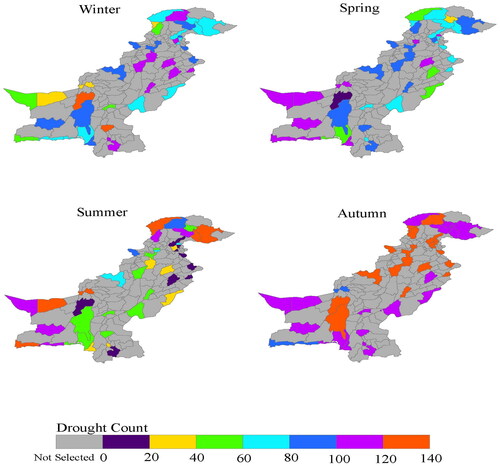
Figure 9. Seasonal drought frequency for each selected station.
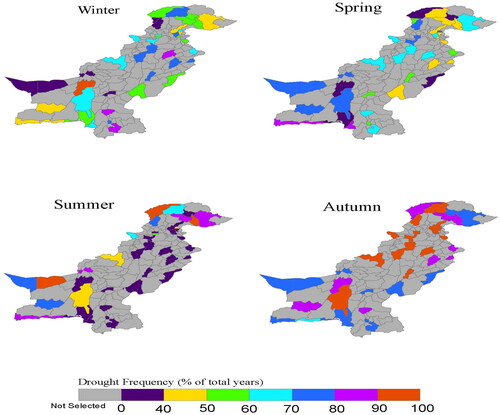
Figure 10. Drought Persistence percent probability for selected stations.
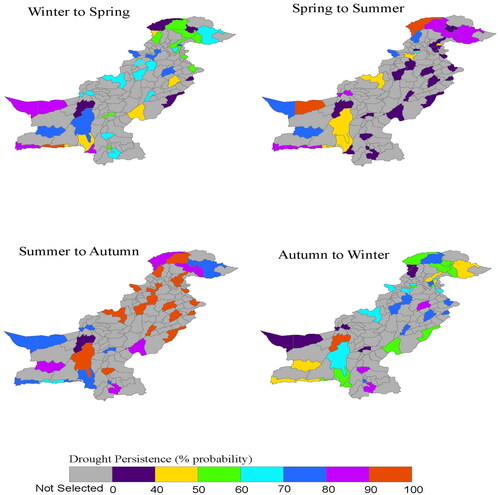
Table 3. Information regarding the winter-spring drought persistence modelling is provided.
Table 4. The results obtained from the RELRM are provided for the winter-to-spring meteorological drought persistence.
Table 5. The results about the spring-summer spatiotemporal drought persistence modelling.
Table 6. The results obtained from the CFELRM are given for the spring-to-summer meteorological drought persistence.
Table 7. The log-likelihood values, LRCST and WCT for RELRM and CFELRM are computed for the summer-to-autumn meteorological drought persistence.
Table 8. The results found from the RELRM are provided for the summer-to-autumn meteorological drought persistence.
Table 9. The values obtained from the various tests for RELRM and CFELRM are given for the autumn-to-winter meteorological drought persistence.
Table 10. The results attained from the RELRM are provided for the autumn-to-winter meteorological drought persistence.
Availability of data and codes
The data and codes used for the preparation of the manuscript are available with the corresponding author and can be provided upon request.