Figures & data
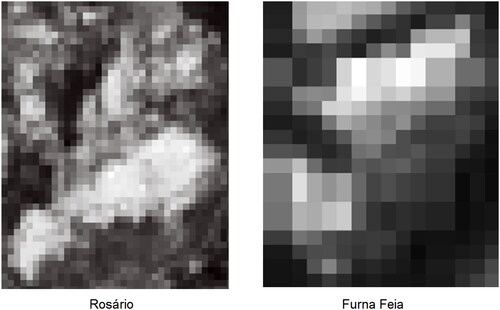
Figure 1. Geological map of the Potiguar basin (A), and the three outcrops placed in the Jandaíra formation: Soledade (B); Rosario (C); and Furna Feia (D).
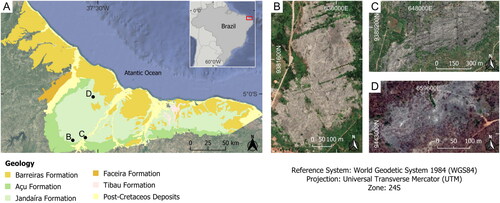
Figure 2. Reflectance spectra for visible and NIR regions of calcite (solid black), dolomite (dashed black), and typical natural targets: dry vegetation (dashed gray), soil (solid gray), Alunite (solid light gray), green vegetation (dashed light gray). Data from Rencz and Ryerson (Citation1999).
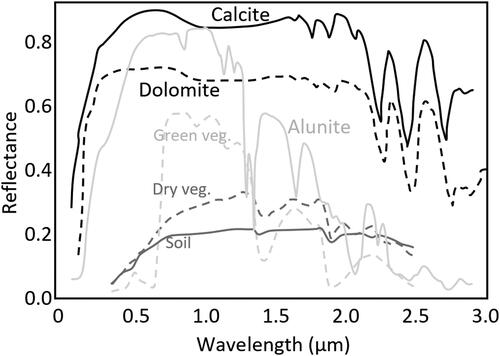
Figure 3. Decision tree for simulated OLI-Landsat 8 data using carbonate rocks against several materials including types of vegetation, different kinds of rocks, bare soils, and water in varied conditions. The carbonate samples were grouped standing by CR class, whereas the remaining non-carbonate classes were all merged to represent NCR class. The result indicates SWIR 2 as best discriminating parameter, followed by visible channel blue.
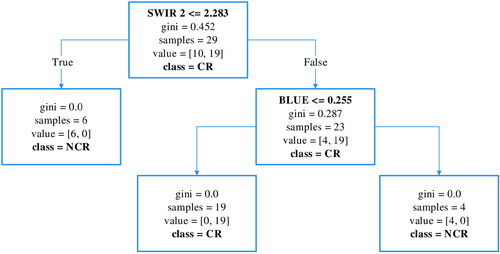
Figure 4. (a) OLI-Landsat 8 RGB 5 654 color composition (b) UAV orthophoto of the outcrop area (light gray region) mainly composed of calcite with some areas of dolomite. (c) The ground truth (GT) is generated from the visual interpretation assisted by an expert in the field. (d) Is the corresponding GT of (c) resized to match the Landsat 8 pixel.
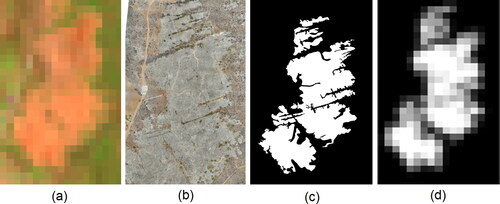
Figure 5. Decision tree produced for real OLI-Landsat 8 pixels with carbonate rocks against other present materials including many types of vegetation, bare soil, and minerals. In agreement with the previous experiment, it also indicates the SWIR region with the best discriminating parameter, followed by visible channels. Similar to what was made in the simulated experiment, the carbonate samples were grouped standing by CR class, whereas the remaining non-carbonate classes were all merged to represent NCR class.
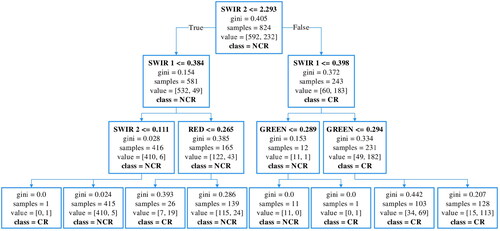
Figure 6. Scatterplot confronting all OLI channels for assigned pixels of CR and NCR. The blue and SWIR2 bands had the most potential for detecting carbonate rocks.
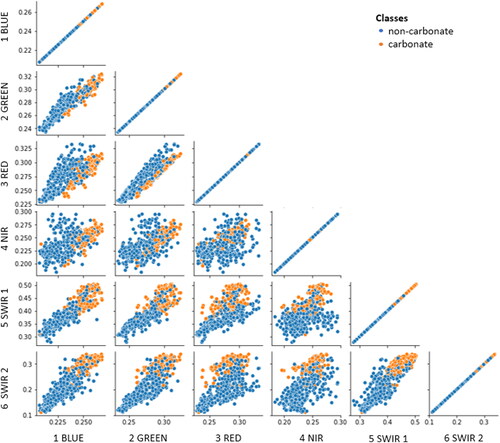
Figure 7. Scatterplot between the classes in the spectral space by comparing two by two the simulated channels of the sensor OLI-Landsat 8. The blue and SWIR2 bands had the most potential for detecting carbonate rocks.
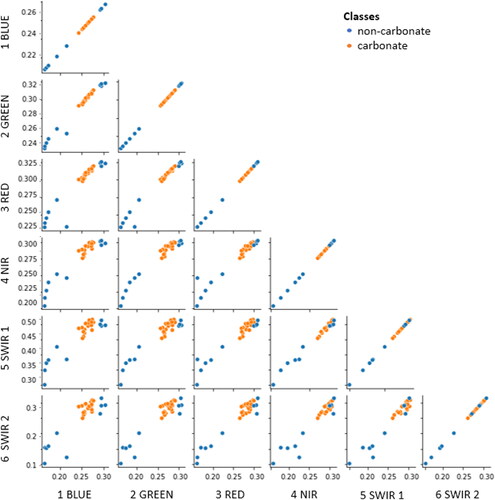
Figure 8. (a) 3-dimensional surface for the original formulation (source domain) of the ACRI index, and (b) corresponding spectral diagram showing isolines designed with reference data from Soledade outcrop. The isolines were important to calibrate zones where the index was more susceptible to the presence of carbonates.
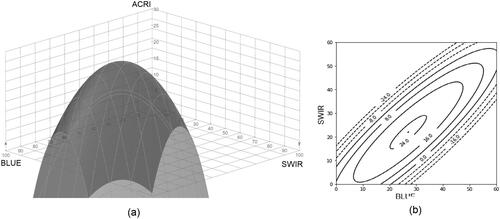
Figure 9. The index result generated using our approach for Soledade outcrop (source domain). Pixels of the index image varies from zero (no carbonates) to one (totally occupied by carbonates).
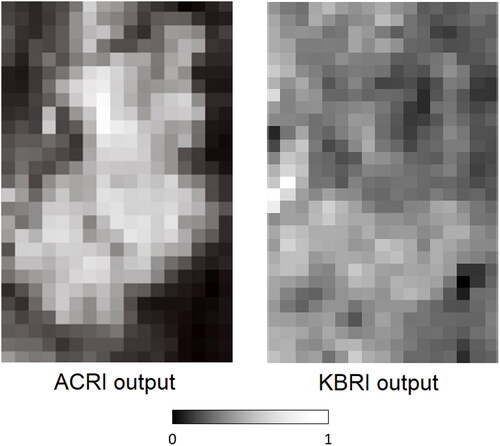
Table 1. Mean Absolute Error (MAE), Mean Square Error (MSE), and when considering 30 random executions of the 20% image window sampling. Higher mean values indicate better results.
Figure 10. OLI-Landsat 8 false color composition RGB 654, the HR ground truth and their corresponding resampled reference image, and the ACRI index result generated using our approach for Rosário and Furna Feia outcrops (same formulation applied in Soledade outcrop). Greyscale images vary from zero (no carbonates) to one (totally occupied by carbonates).
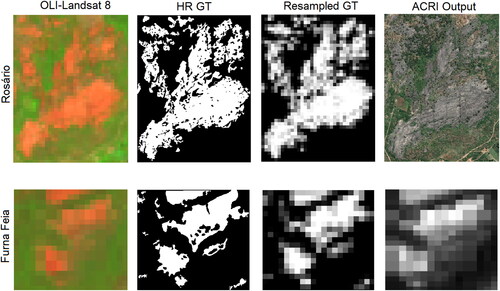
Figure 11. Basic Genetic Algorithm workflow.
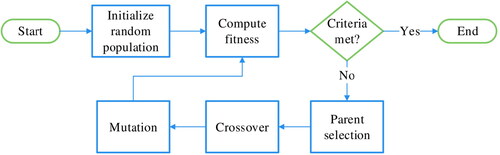
Figure 12. 3-dimensional index surface after adjusting coefficients by supervised genetic algorithm proposed. (a) Rosário and (b) Furna Feia. Viewing perspectives are fixed and the same as in .
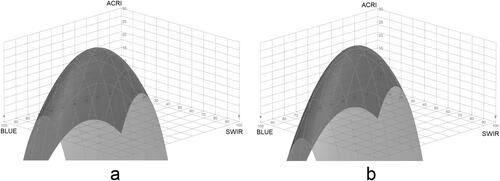
Table 2. Adaptive coefficients after convergence for source and target domains.
Table 3. ACRI after adaptation for Furna Feia and Rosario outcrops using the same 30 random executions of the 20% image window sampling. Lower mean values indicate better results.
Figure 13. Result generated after adaptation for Rosário and Furna Feia outcrops (target domains). Grey scale images vary from zero (no carbonates) to one (totally occupied by carbonates). Visual results are very similar to what was found in 13, however quality scores depicted in show overall improvements.