
Figures & data
Figure 1. The study area, with captured UAV image on the background of a true colour image from high resolution satellite, with ground truth points and their elevation in meters.
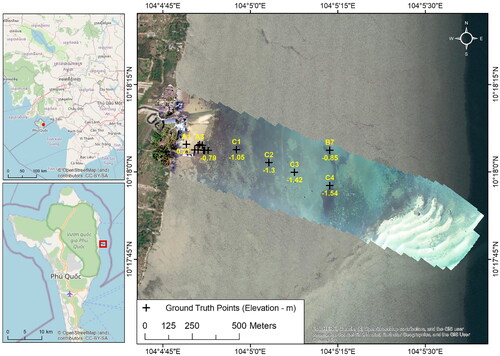
Table 1. List of images used for the analysis.
Table 5. Correlation between classification accuracy and tide levels.
Figure 2. The overall flow chart of image analysis.
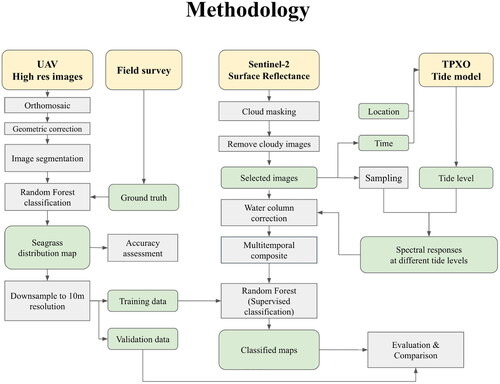
Figure 3. The orthomosaic of the UAV images.
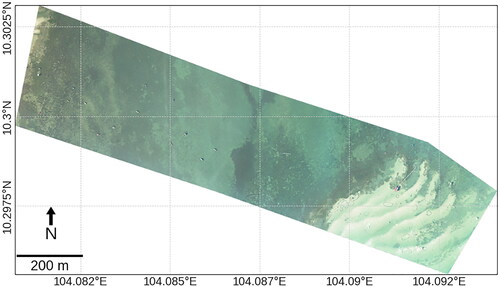
Figure 4. (a) Close ups on the UAV image, (b) object-based segmentation result, and (c) classification result.
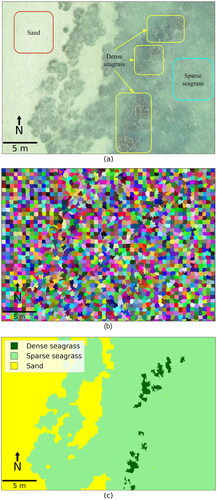
Table 2. List of indices used in this paper.
Table 3. Theil Sen slope and coefficient of determination (in brackets) between the natural log of blue, green, red, nir, and swir1 against tide levels for Dense seagrass, Sparse seagrass, and Sand.
Figure 5. (a) The classification of the orthomosaic, and (b) the downsampled classification result of the UAV images.
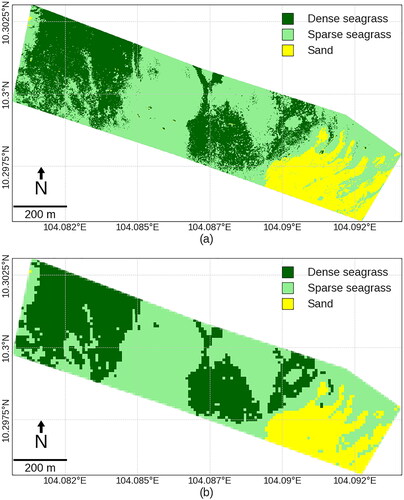
Table 4. Table of inputs for classification.
Figure 6. Tide levels at image acquisition time (10:20 am local time) for the Sentinel-2 images analysed.
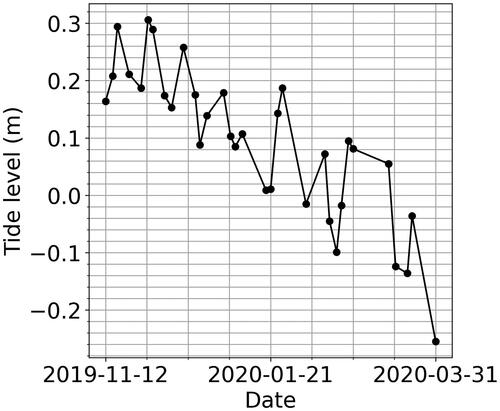
Figure 7. True colour composite and classified images from Sentinel-2 satellites at high and low tides. (a), (b), and (c) show the true colour composite. (d), (e), (f) show the classification result without water column correction and (g), (h), (i) show the classification result with water column correction. (a), (d), (g) are captured at low tide, (b), (e), (h) at medium tide and (c), (f), (i) at high tide.
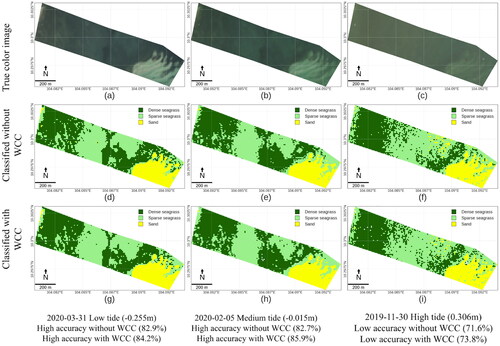
Figure 8. Logarithms of reflectance of the blue, green, red, near infrared, short-wave infrared 1 and short-wave infrared 2 of Dense seagrass, Sparse seagrass, and Sand at different tide levels. Red lines show the regression slope of a Theil Sen Robust regression.
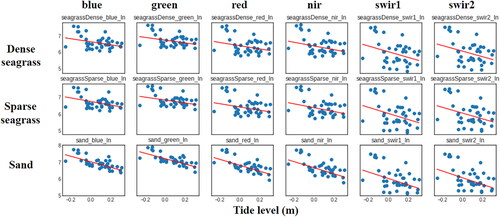
Figure 9. Overall accuracy of classification results of seagrass at different tide levels for images with and without water column correction.
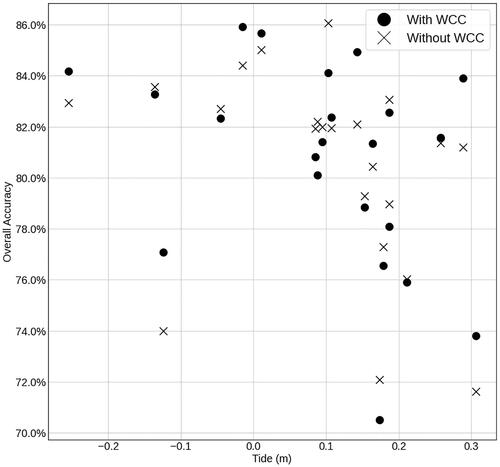
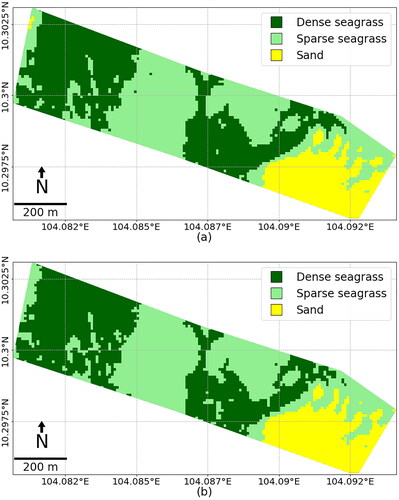
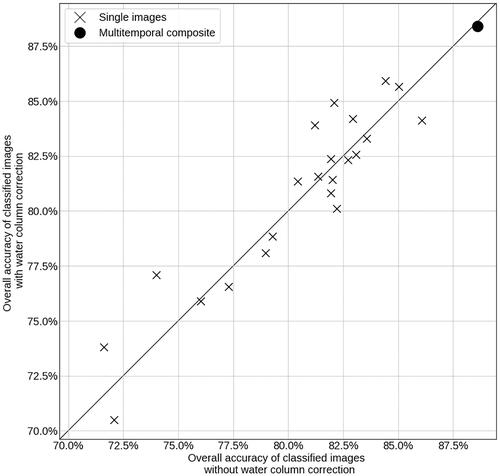
Figure 11. Comparison between the classification accuracy of images with and without water column corrections, and between classifying single images and the multitemporal composite.
Supplemental Material
Download MS Word (3.8 MB)Data availability statement
Sentinel-2 datasets were obtained from Google Earth Engine data catalogue at https://developers.google.com/earth-engine/datasets/catalog/sentinel
TPXO Tide model data were obtained from the API at https://www.worldtides.info/
The UAV images, JavaScript and Python code for processing are available on request from the author.