
Figures & data
Table 1. Data resources.
Table 2. Area (ha) of each land use class.
Figure 1. Study area of Bogota, Colombia.
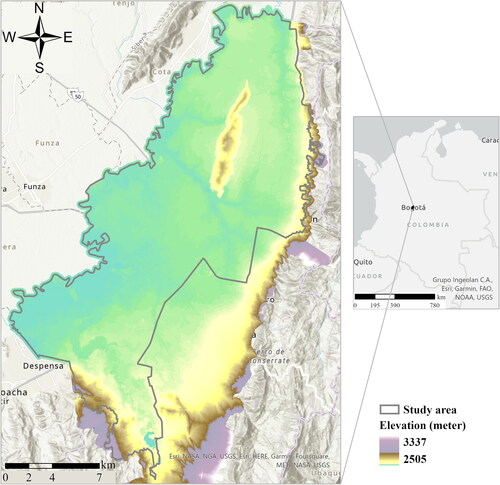
Figure 2. Driving factors - a detailed map of urban geomorphology together with the legend is attached as Appendix (see ).
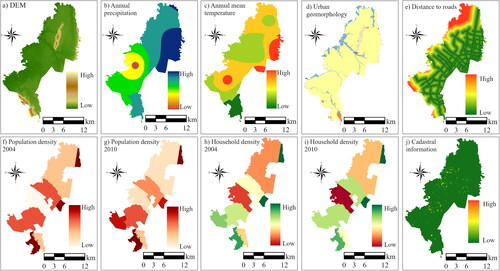
Figure 3. Schematic diagram of the methodology.
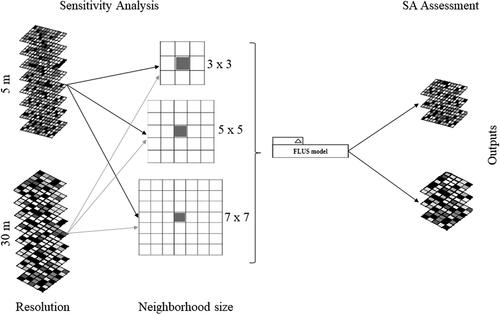
Table 3. Metrics used for SA assessment.
Figure 4. Results from the SA assessment through cross-map method for 5 m spatial resolution. C (constructions), CP (crops and pastures), W (water), UGS (urban green spaces), Wet (wetlands).
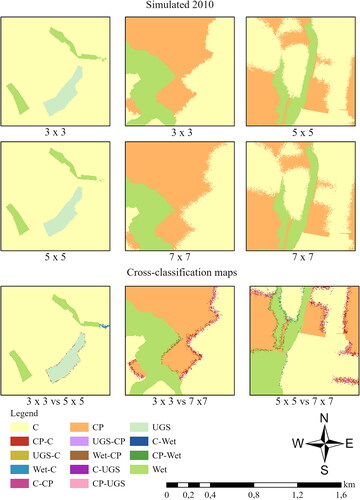
Figure 5. Results from the SA assessment through the cross-map method for 30 m spatial resolution. C (constructions), CP (crops and pastures), W (water), UGS (urban green spaces), Wet (wetlands).
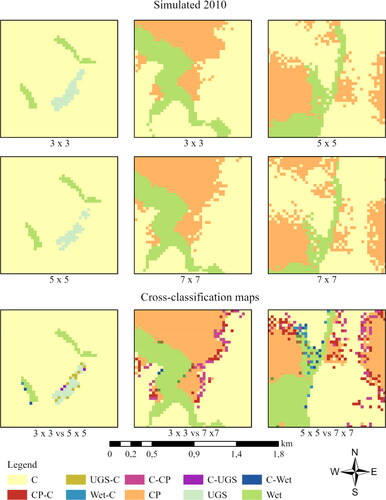
Table 4. Overall accuracy for cross-classification maps with wetlands mask.
Table 5. Landscape metrics for neighborhood sizes 3 x 3, 5 x 5, 7 x 7 for 5 m and 30 m spatial resolution.
Table 6. SA assessment of the outcomes indicated by the OA, PA, and FoM.
Figure 6. AUC of the TOC - zoom of with thresholds.
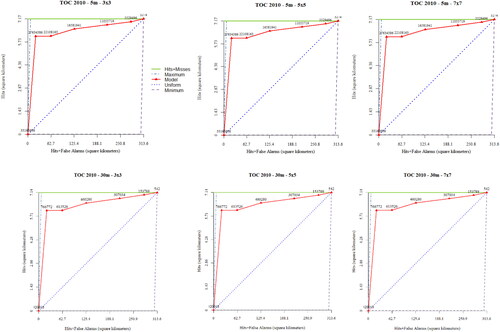
Figure 7. Graph of fuzzy Kappa index and similarity above each bar for wetlands land-cover.
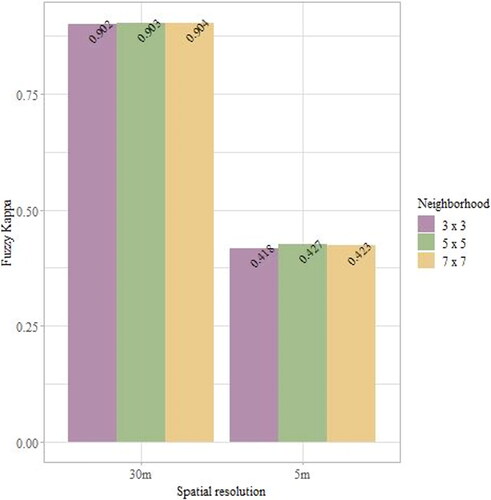
Figure 8. Quantity disagreement, allocation disagreement.
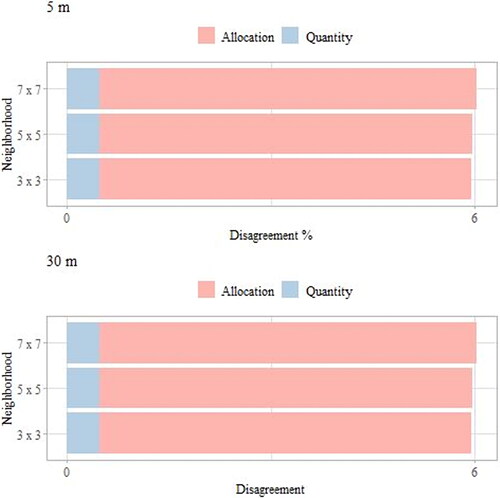
Figure A1. Urban geomorphology.
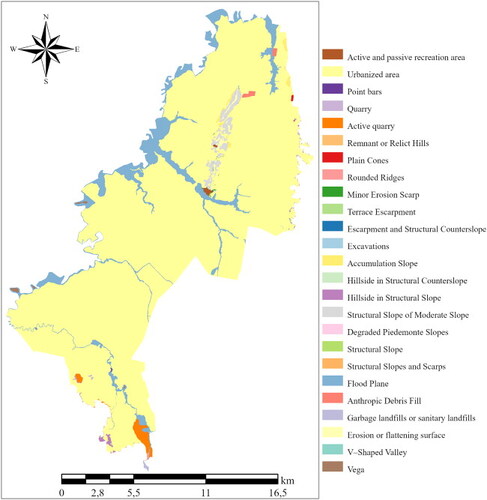
Figure A2. Sensitivity analysis using TOC for wetlands land use class.
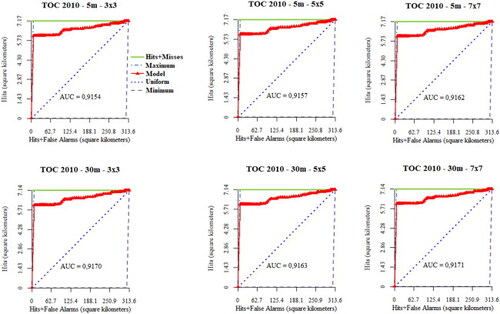
Table A1. Agreement and disagreement values for wetland land use class.
Table A2. Confusion matrix-5 m resolution 3x neighborhood size.
Table A3. Confusion matrix-5m resolution 5x neighborhood size.
Table A4. Confusion matrix-5m resolution 7x neighborhood size.
Table A5. Confusion matrix-30m resolution 3x neighborhood size.
Table A6. Confusion matrix-30m resolution 5x neighborhood size.
Table A7. Confusion matrix-30m resolution 7x neighborhood size.