
Figures & data
Figure 1. The study areas.
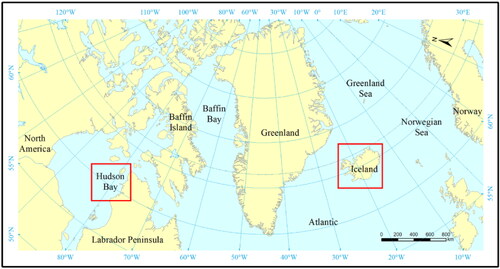
Figure 2. (a) Observation schematic of the CSCAT, (b) Schematic of fan-beam footprint.
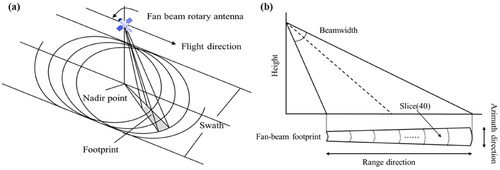
Figure 3. The pattern of the VV-polarized antenna.
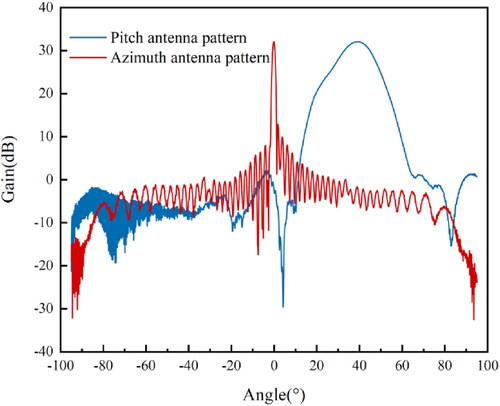
Figure 4. The geometry of the footprint slice.
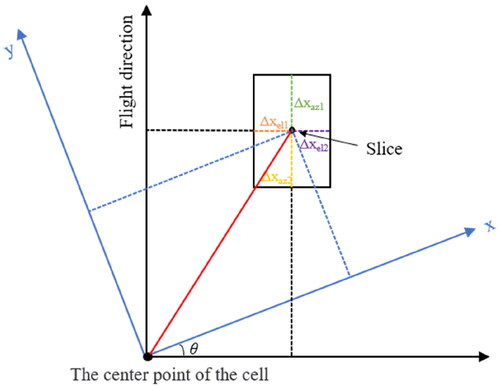
Figure 5. Pixelation of slice on the imaging grid.
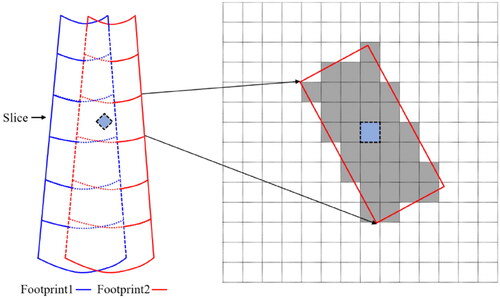
Figure 6. Normalized standard deviation of AART, MART and SIR as a function of the number of iterations for Iceland region.
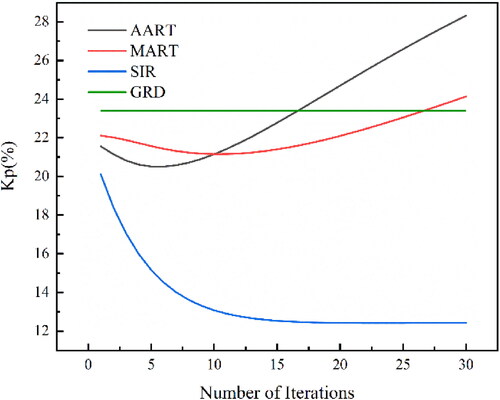
Figure 7. Image reconstruction of Iceland by different algorithms. (a) Original backscatter coefficient distribution, (b) fDIB GRD image at 10 km, (c) AART-reconstructed image at 5 km, (d) MART-reconstructed image at 5 km, and (e) SIR-reconstructed image at 5 km.
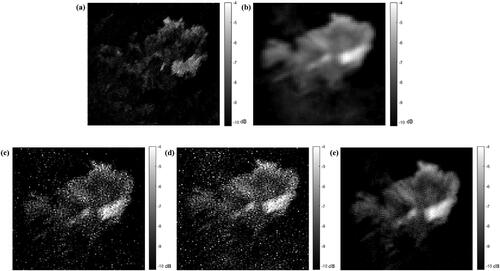
Table 1. Data statistics of fDIB GRD, AART, MART, and SIR methods for Iceland and Hudson Bay region.
Table 2. Correlation coefficients, RMSE, SSIM, and PSNR between the AART, MART, and SIR images and nonenhanced images for Iceland and Hudson Bay region.
Figure 8. Normalized standard deviation of AART, MART and SIR as a function of the number of iterations for Hudson Bay region.
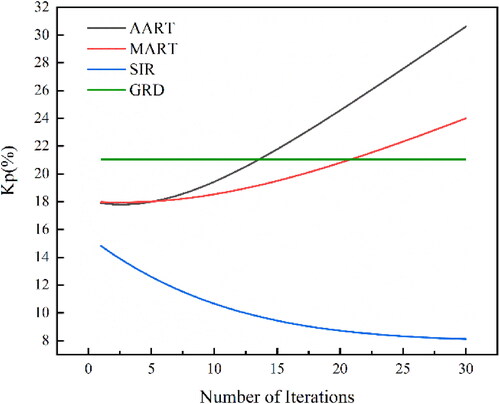
Figure 9. Image reconstruction of Hudson Bay by different algorithms. (a) Original backscatter coefficient distribution, (b) fDIB GRD image at 10 km, (c) AART-reconstructed image at 5 km, (d) MART-reconstructed image at 5km, and (e) SIR-reconstructed image at 5 km.
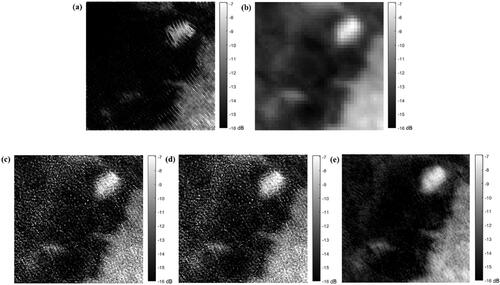
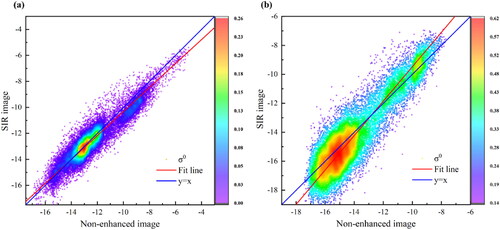
Figure 10. Scatter density plots between images reconstructed with the SIR algorithm and non-enhanced images. (a) Iceland region, and (b) Hudson Bay region.
Data availability statement
The data that support the findings of this study are available from the corresponding author upon reasonable request.