Figures & data
Figure 1. Map of the study area.
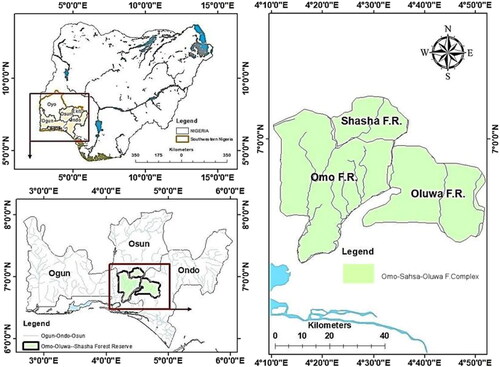
Figure 2. Drone sampling plots derived from Unsupervised Classification of Worldview 1 imagery.
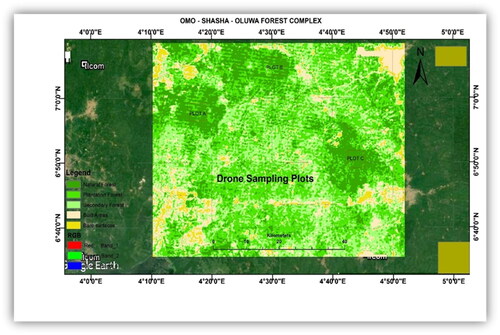
Table 1. Flight characteristics, and image quality parameters derived from Structure for Motion (SfM).
Table 2. Pearson Correlation matrix showing the strength of association between the biophysical variables and location.
Figure 3. Flight planning of the study area in e-Motion software for the Sensefly Ebee Unmanned Aerial Vehicle (UAV).
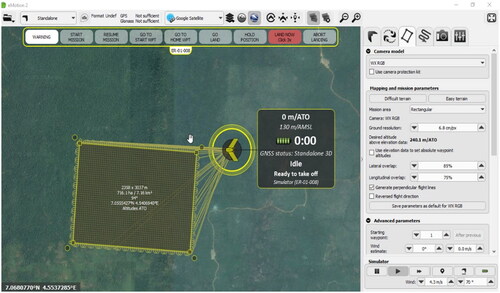
Figure 4. Orthomosaics in False Color Composite and different stages of segmentation to obtain the final tree canopies.
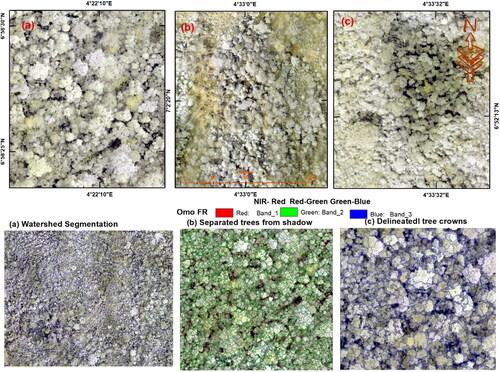
Figure 5. The distribution and tree crown characteristics in the sampled plot.
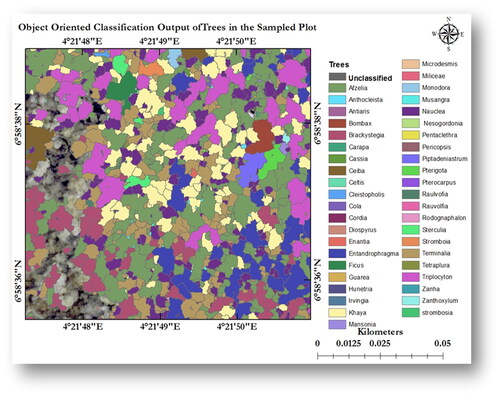
Figure 6. Carbon stock estimates of individual trees in kilograms in the sampled plot.
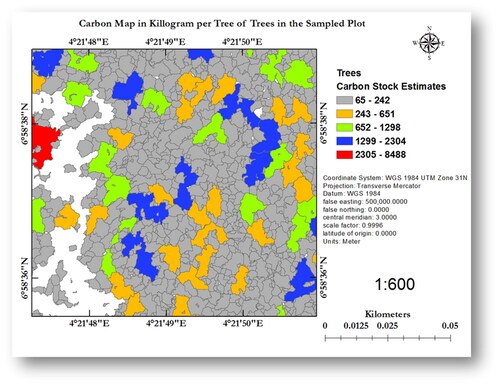
Figure 7. Relationships between the variables within the Principal Component Sampled Space.
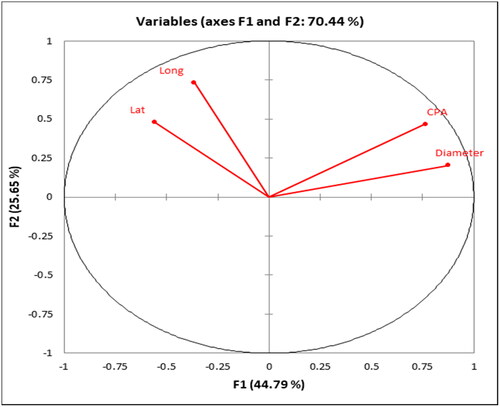
Figure 8. Observed variables in 2-dimensional sampled space of Principal Component Analysis.
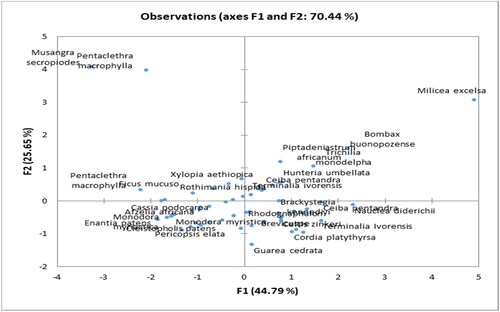
Figure 9. Biplot relationship and directions of biophysical variables to location and topography.
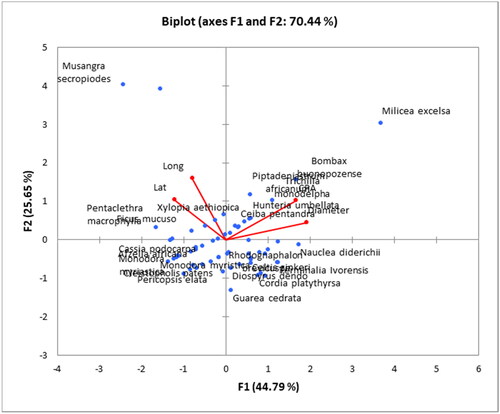
Figure 10. Distribution between tree crown and stem diameter.
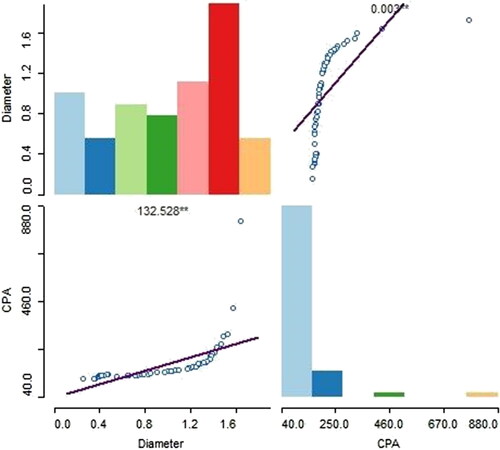
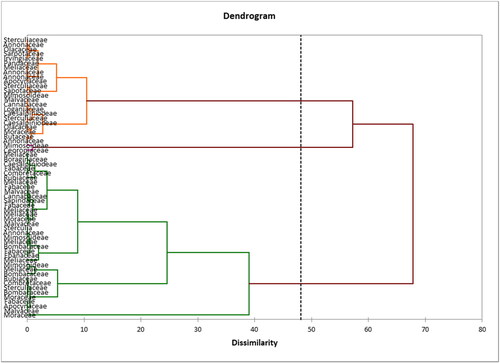
Figure 11. Groupings and variations of tree families within the sampled plot.