
Figures & data

Figure 1. (a) the location of the two subbasins (the BNB and the White Nile basin) of the NRB and the streamflow stations (b) the location of Sudan and the damage and losses of their states caused by the flood event of 2020 (modified from (UNOCHA (United Nations Office for the Coordination of Humanitarian Affairs) Citation2020)).
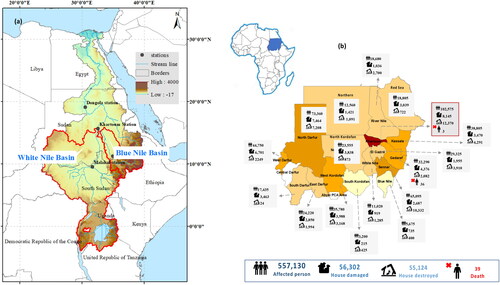
Figure 2. flow chart represents the Methodology steps.
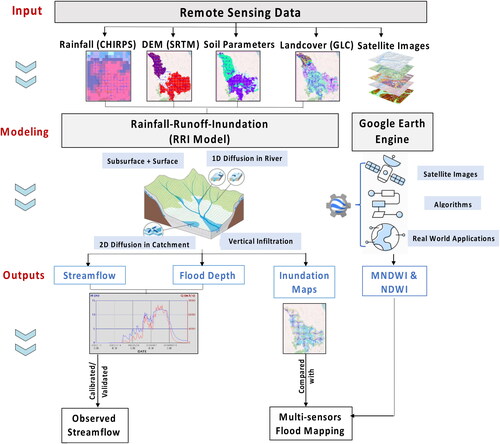
Table 1. Summary of satellite images and reanalysis data used in this study.
Figure 3. The hydrograph of simulated results and the observed discharge (a) Khartoum station (daily time scale) (b) Khartoum station (monthly time scale) (c) Malakal station (monthly time scale).
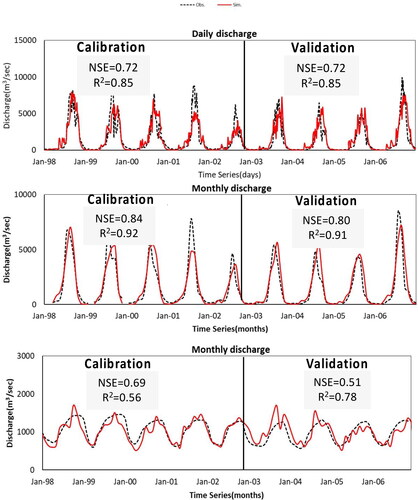
Table 2. Statistical indices for the evaluation of the RRI model’s performance.
Figure 4. The flood inundation extends maps using four sensors over Khartoum state (a) MODIS (b) Sentinel-1 c) Sentinel-2 d) Landsat 8.
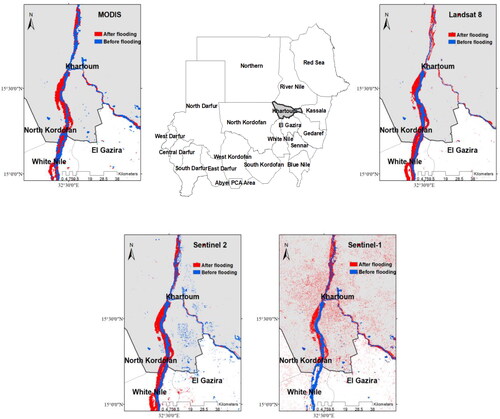
Figure 5. Estimated flood extent by each sensor.
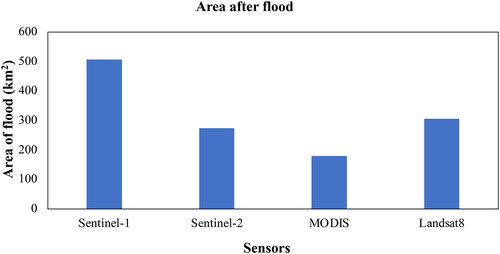
Figure 6. Mapping of flood inundation extent over the most affected states for two sensors (MODIS, Sentinel-2) and RRI results.
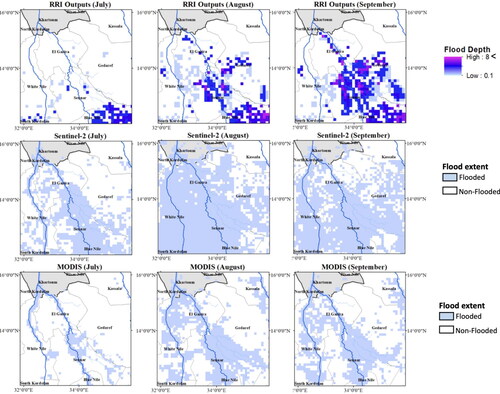
Figure 7. Categorical Statistical indicators used to evaluate the performance of sensors in detection flood inundation.
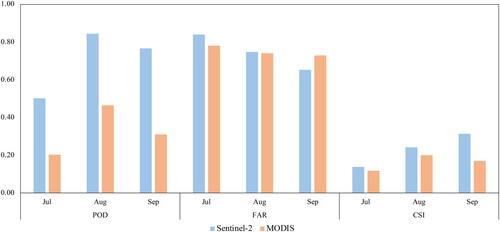
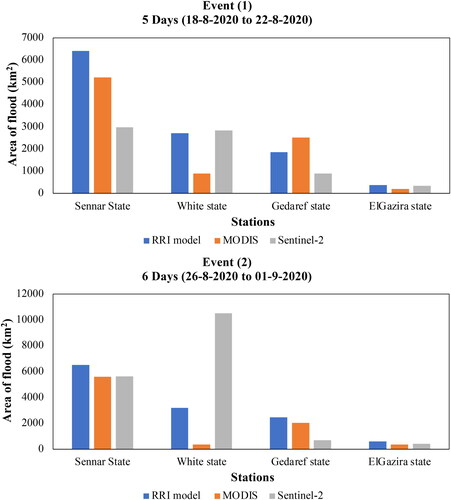
Figure 8. Flood inundation area of the two extreme flood events as estimated by two sensors and the RRI model over different states.
Supplemental Material
Download MS Word (428.7 KB)Data availability statement
The data that support the findings of this study are available from the corresponding author, [Hadir Abdelmoneim], upon reasonable request.