
Figures & data
Figure 1. Study area. The R:G:B composite of Sentinel-2 optical image and VV:VH:ratio composite of Sentinel-1 radar image on the right side, respectively.
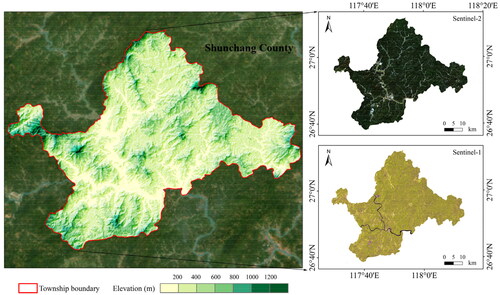
Figure 2. Location of samples used in validation, including bamboo forest and nonbamboo forest. (a, b) bamboo forest sample. (c, d) nonbamboo forest sample. Base maps are Google Earth images.
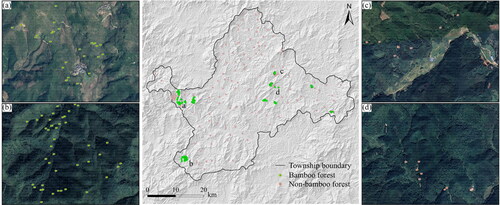
Table 1. The dataset used in this study.
Table 2. Sample data.
Figure 3. Flow chart of the proposed bamboo forest information extraction method.
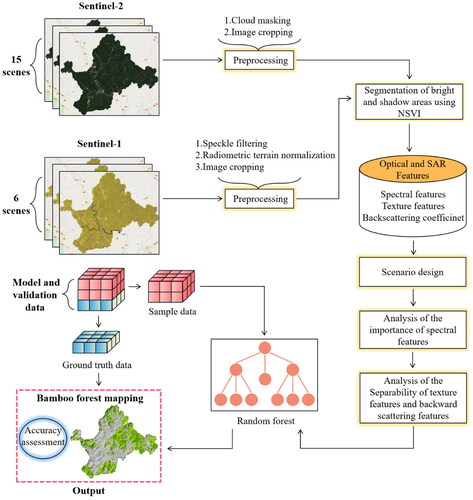
Table 3. Four feature models for bamboo forest mapping.
Figure 4. Importance ranking of Sentinel-2 original bands, vegetation index and red edge index features. (a) The importance ranking of features in bright areas, (b) the importance ranking of features in shadow areas. The orange represents the original bands, the yellow represents the vegetation index and the blue represents the red edge index and the solid line represents the cumulative percentage of different features from left to right.
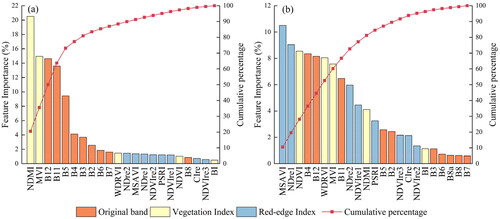
Figure 5. Bright area and shadow area recursive feature importance evaluation. The solid line represents the overall accuracy (OA). The circles at the intersection of the solid and dashed lines represent the OA corresponding to the best feature dimension. Red and blue represent the bright and shadow areas, respectively.
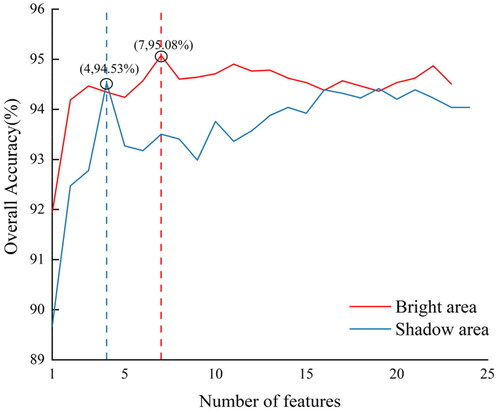
Figure 6. Importance ranking of the bright and shadow Sentinel-2 original bands. The horizontal axis represents the 10 original bands of Sentinel-2, and the vertical axis represents the feature importance values of the input variables. The red and blue represent the bright and shadow areas, respectively.
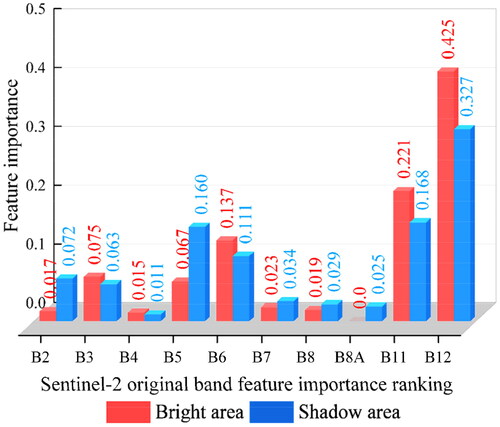
Table 4. Results of feature variable selection for different strategies.
Figure 7. Feature values of bamboo and nonbamboo forests in different areas on texture features. (a) Sentinel-2 texture features in bright areas, (b) Sentinel-2 texture features in shadow areas. The horizontal axis represents the seven texture features of the Sentinel-2 optical image, and the vertical axis represents the features normalized by the min–max method. In the violin box plot, the white point is mean, and the green and orange represent bamboo forest and nonbamboo forest samples, respectively.
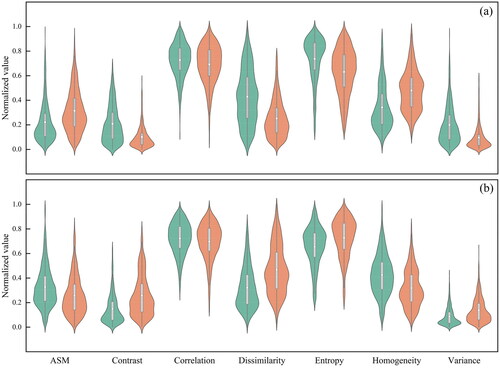
Figure 8. Feature values of backscatter coefficients for bamboo and nonbamboo forests in different areas. (a) Sentinel-1 backscatter coefficient features in bright areas, (b) Sentinel-1 backscatter coefficient features in shadow areas. The horizontal axis represents the four backscatter coefficient features of Sentinel-1 SAR images, and the vertical axis represents the features normalized by the min–max method. In the violin box plot, the white point is mean, and the green and orange represent the bamboo forest and nonbamboo forest samples, respectively.
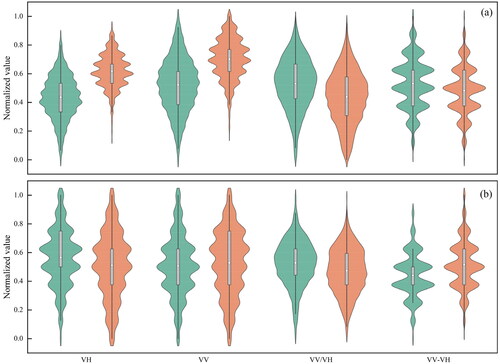
Figure 9. Multi-temporal SAR backscatter of bamboo and nonbamboo forests in bright and shadow areas. (a) VV polarization, (b) VH polarization.
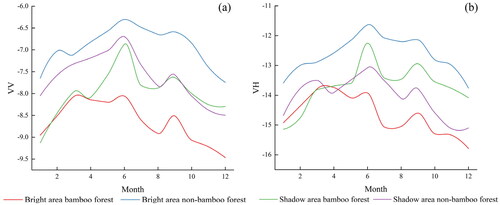
Figure 10. Four classification results for different combinations of features. (a) FM1, (b) FM2, (c) FM3, (d) FM4.
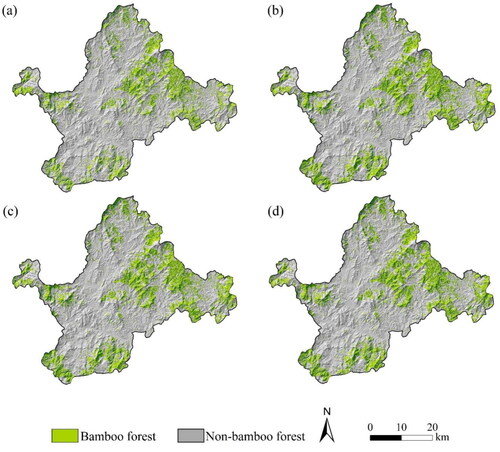
Figure 11. The classification results in three validation regions using four feature models of FM1, FM2, FM3 and FM4.
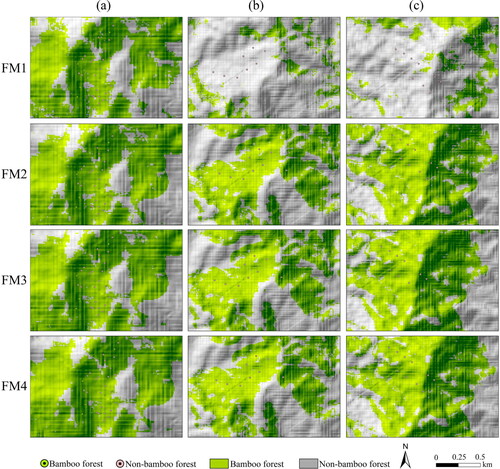
Table 5. Classification accuracy statistics for different feature models.
Figure 12. Topographic factor classification map of bamboo forest classification results. (a) Elevation, (b) slope, (c) aspect.
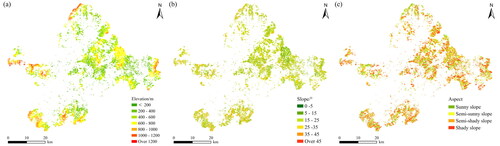
Figure 13. Percentage of bamboo forest classification results for each class under different topographic factors. (a) Elevation, (b) slope and (c) aspect. The horizontal axis represents the interval of terrain factor classification, and the vertical axis represents the percentage of input variables.
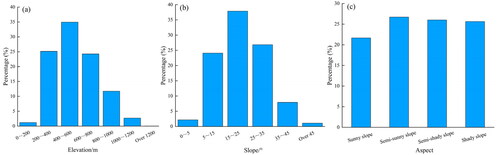
Figure 14. Canopy spectral reflectance of bamboo forest in Sentinel-2 MSI. The red solid line is the spectral reflectance of bamboo forest in bright area, and the blue solid line is the spectral reflectance of bamboo forest in shadow area.
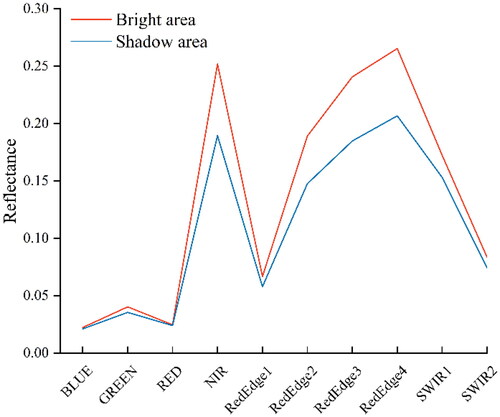
Table 6. Model classification accuracy statistics for bright area, shadow area and both combined NIR and red-edge band samples.