
Figures & data
Figure 1. Polarized-intensity joint imaging system and the output images. The central circular diagram is an equipment layout diagram, and the three cameras on the optical plate in the figure from left to right are the P-polarization camera, I-visible light intensity camera, and IR-infrared camera. The green, yellow, and red labeled lines indicate that the images (A), (B), and (C) were, respectively, acquired by the P, I, and IR cameras. Among them, image (A) shows the image obtained by the wide-field visible intensity camera, with the region of interest indicated by a black box. Sub-image (A') shows a zoomed-in view of the region of interest in image (A). Image (B) shows the raw image obtained by the high-magnification polarization camera, and the yellow box indicates the region where the sky meets the hull of the ship. Image (B') shows a magnified view of this region, revealing a grid pattern produced by polarization differences. Image (C) is obtained by the near-infrared camera. The camera used the same high-magnification lens model as the polarization camera. However, due to the large pixel size and low number of the sensor pixels, the image is of low quality and blurred.
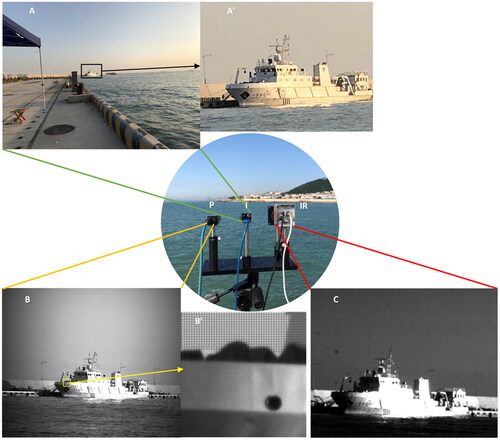
Figure 2. The DoP image of target and the jaggy artifacts. The left one is DoP image from the raw image of the DoFP camera, the right one is an enlargement of the yellow box on the left, showing obvious jagged edges along the diagonal and arc edges.
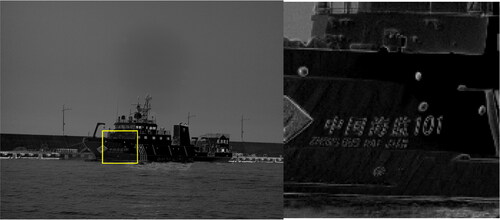
Figure 3. Flow chart of DoP image sharpened with detail from Raw image. (A) is the raw image from the DoFP camera, (B) is the DoP image, (C) is the filtered raw image, (D) is the detail edge extracted from (C), and (E) is the sharpened image. The square image is the enlarged local area highlighted by the yellow box in the original image. The figure shows the process of obtaining a grid-free DoP image from the raw image with a grid using a bilateral joint filtering approach with a DoP image. High-frequency details were extracted using Laplacian edge detection and injected back into the DoP image to obtain a magnified and sharpened DoP image.
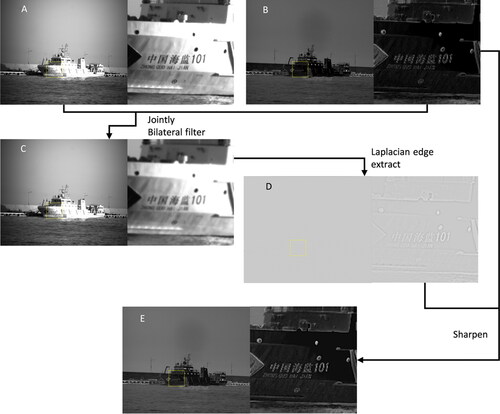
Table 1. Estimation index of sharpened DoP image and original DoP image, bold indicates the best performance.
Figure 4. A view of ×4 super-resolution intensity image by different algorithms. The square image is the area circled by the yellow box in the original image. The magnification ratio and super-resolution method used for each image block are indicated in the corresponding image block.
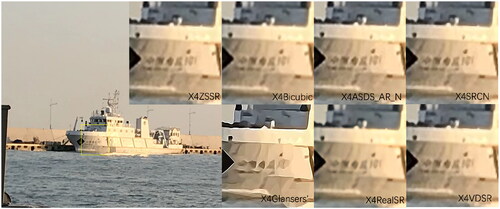
Table 2. Estimation index of ×4 super-resolution intensity image and original intensity image, bold and underline indicate the best and second-best performance, respectively, ↑ indicates that the index is positively correlated with image quality, and ↓ indicates that this index is negatively correlated with image quality.
Figure 5. The DoP image (A) is differentially fused with intensity image (B) to obtain (D), infrared image (C) is fused into the red channel of intensity image (B) to obtain (E). The black region in sub-image (C) is due to the limited image size of the infrared camera, resulting in a small image. After registering with the DoP image and visible intensity image, an information gap appears in the black region.
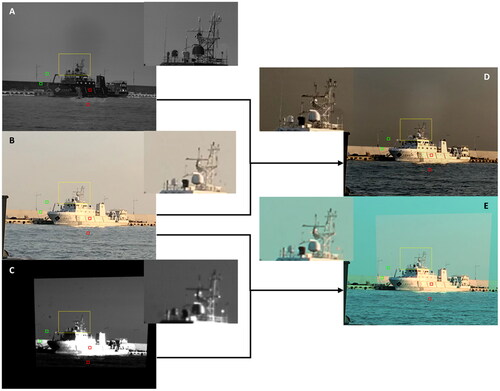
Table 3. Contrast ratio of representative ROIs for different images, where green is the sky-dock comparison and red is the sea-ship target comparison.
Table 4. Estimation index of intensity image, Intensity-DoP fused image, and Intensity-infrared fused image at ×4 super-resolution.
Data availability statement
The data that support the findings of this study are openly available: https://github.com/alicezhong93/a-pair-of-source-image-by-polarized-intensity-joint-imaging.