
Figures & data
Figure 1. Maps showing the location of the metropolises and their underlying geologic formations.
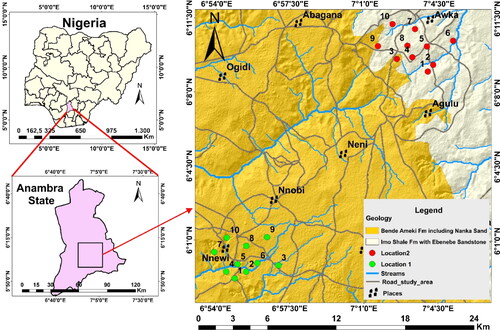
Figure 2. A methodology flowchart depicting the study components and steps.
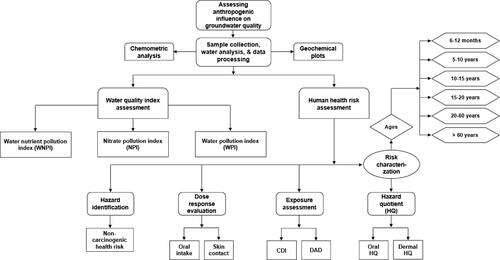
Table 1. Nitrate health risk parameters and their values for the various age groups (Ramalingam et al. Citation2022).
Table 2. Physicochemical variables tested in groundwater resources from the urban clusters.
Table 3. Descriptive statistics of the analysed water quality parameters.
Table 4. Results of the WNPI, NPI and WPI assessments of the groundwater quality of the urban clusters.
Figure 3. Q-mode hierarchical dendrograms for classifying the water samples based on (a) NPI, (b) WNPI and (c) WPI. Samples 1–10, respectively, represent ABH1–ABH10, whereas samples 11–20 represent NBH1–NBH10, respectively.
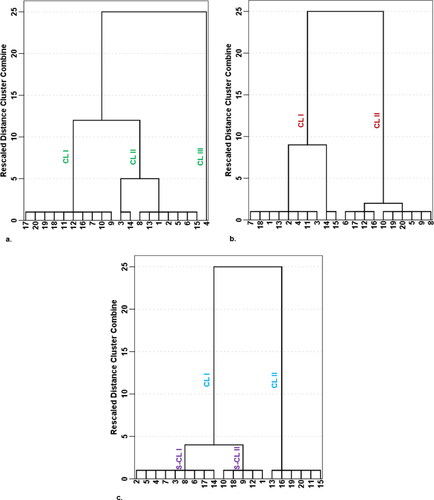
Figure 4. Trends observed from the distribution of the water quality indices – WNPI, NPI and WPI. Samples 1–10, respectively, represent ABH1–ABH10, whereas samples 11–20 represent NBH1–NBH10, respectively.
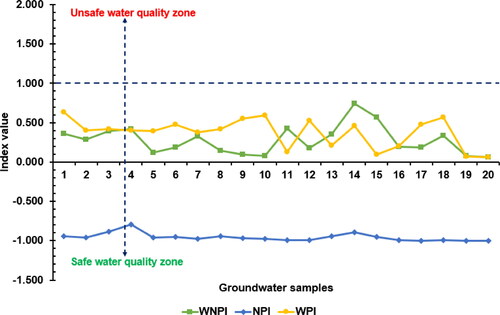
Table 5. Result of the nitrate oral exposure health risk computation for the six age groups in the urban clusters.
Table 6. Result of the nitrate dermal contact exposure health risk computation for the six age groups in the urban clusters.
Table 7. Total hazard index (THI) for the six age groups and the cumulative THI values for the urban clusters.
Figure 5. Chadha plot showing the predominant water types in the study area.
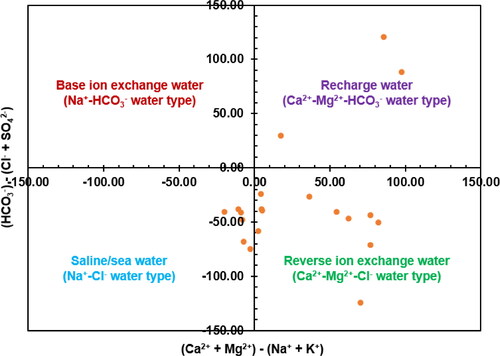
Figure 6. Plots showing the geogenic implication of the relationships between (a) Ca2+/Na+ versus HCO3-/Na+ and (b) Ca2+/Na+ versus Mg2+/Na+.
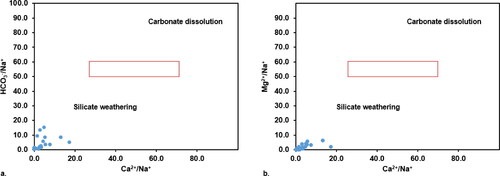
Figure 7. Plots showing the anthropogenic implications of the relationships between (a) NO3- versus K+, (b) NO3- versus Cl-, (c) NO3-/Cl- versus Cl- and (d) SO42-/Ca2+ versus NO3-/Ca2+.
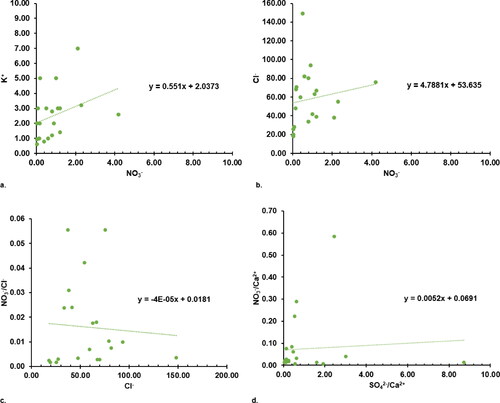
Figure 8. 3D image showing the graphical distribution of the principal components.
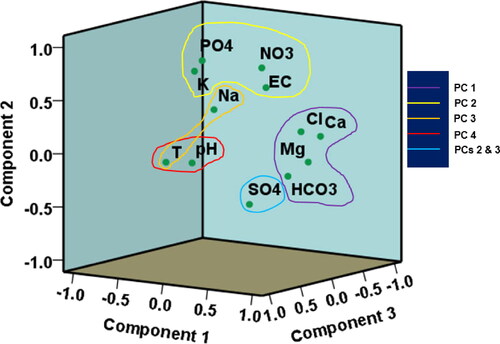
Table 8. Main extractions from the principal component analysis.
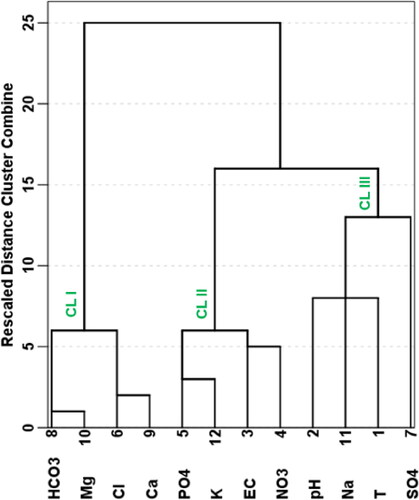
Figure 9. R-mode hierarchical dendrogram for evaluating the possible influencers of water contamination.
Data availability statement
All the data used in this article are provided herein.