
Figures & data
Figure 1. A map of the study area and spatial distribution of meteorological stations.
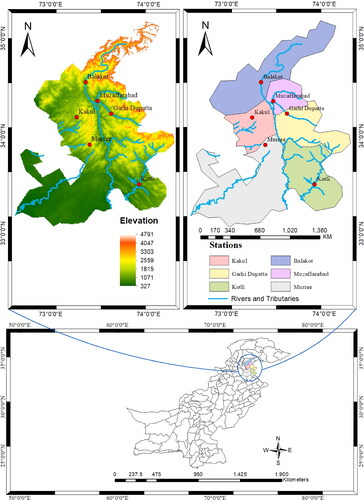
Figure 2. Histograms of precipitation data and varying fitted distributions for SPI-3.
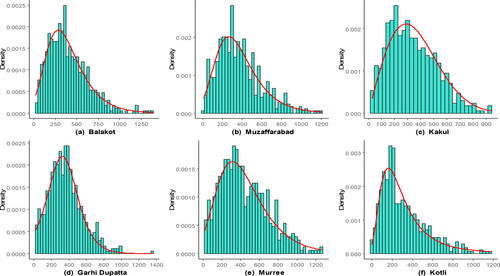
Figure 3. A q-q plot of empirical vs. theoretical distributions for SPI-3 at selected meteorological stations.
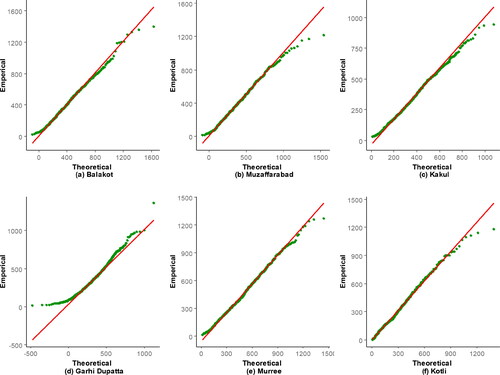
Figure 4. Temporal variations of SPI-3 at selected meteorological stations.
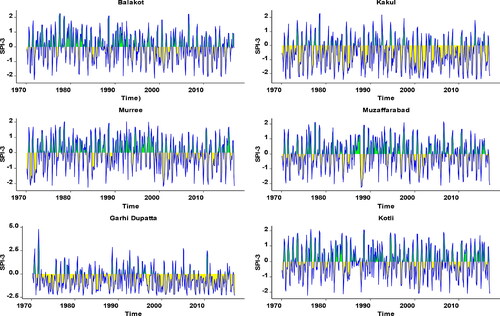
Table 1. Descriptive analysis of precipitation during the period 1971–2017 of selected meteorological stations.
Table 2. Best-fitted probability distributions for the calculation of SPI-3 with their respective BIC values at selected meteorological stations.
Table 3. Seasonal rainfall variations and climatic features of selected meteorological stations.
Figure 5. Temporal behaviour of selected meteorological stations.
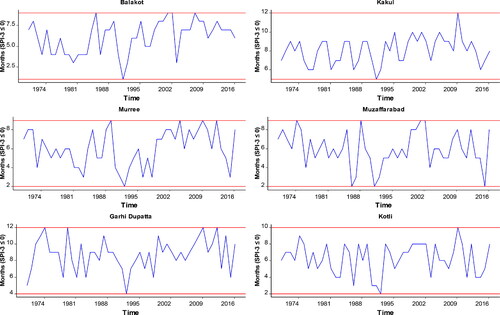
Figure 6. Seasonal drought counts (total number of moths with ) at selected stations.
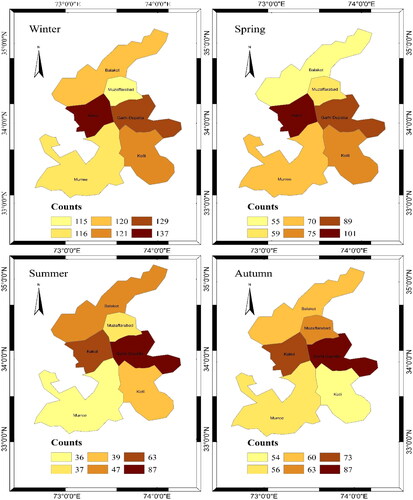
Figure 7. Average number of months with per year at each selected station.
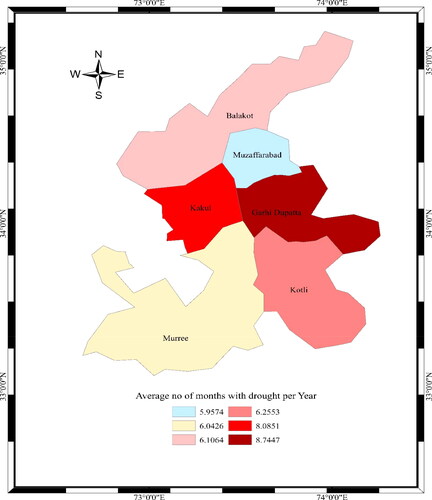
Figure 8. Seasonal drought frequency as a percentage of total years (1070–2016) at each station.
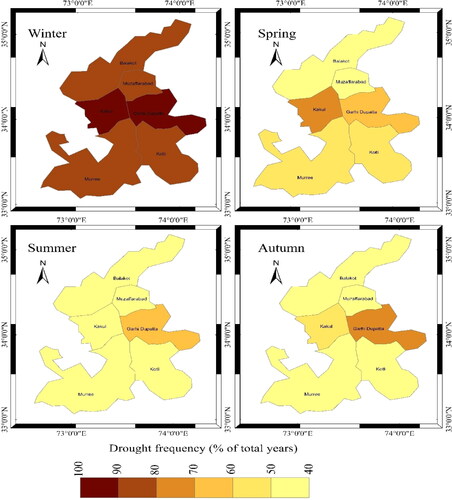
Figure 9. Drought persistence percent probability for all seasons in the selected stations.
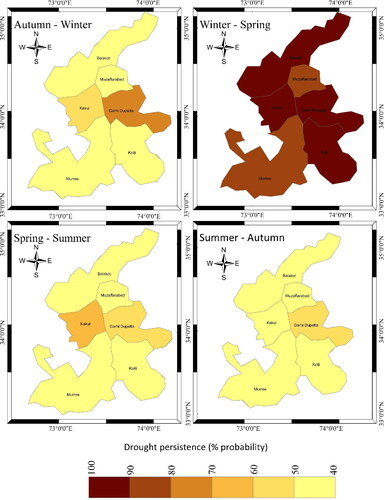
Table 4. Regional average of seasonal drought frequency as measured by percent probability.
Table 5. Regional average of seasonal drought persistence as measured by percent probability.
Figure 10. Posterior trace plots of the logistic regression coefficient associated with predictor (SPI) for all seasons at Balakot station.
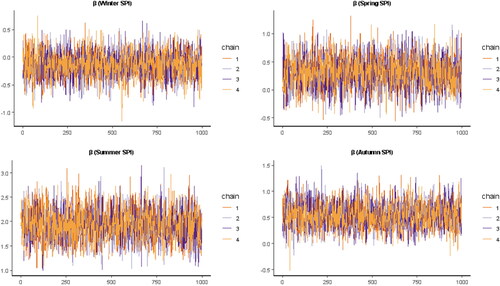
Figure 11. Posterior predictive checks for seasonal drought occurrence at Balakot station.
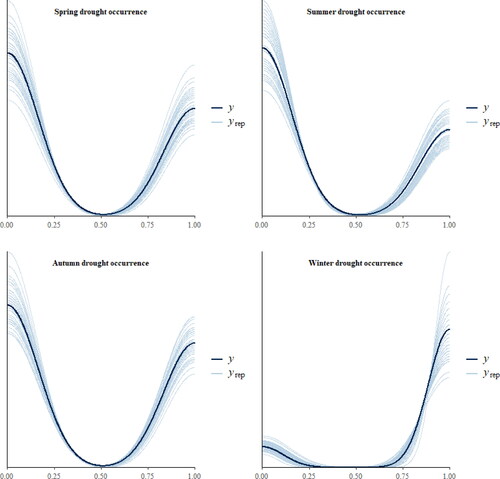
Figure 12. Histograms with the distribution of posterior values combining all chains by estimated parameters (β) for all seasons at Balakot station.
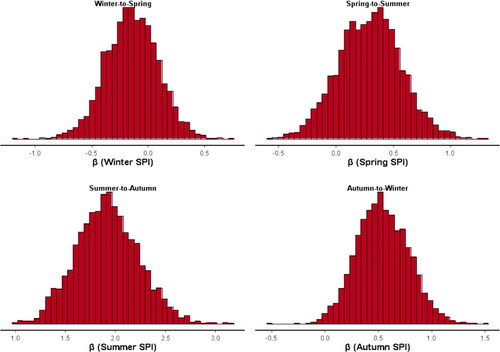
Figure 13. Seasonal drought probability distributions as a function of the previous season’s SPI for Balakot station.
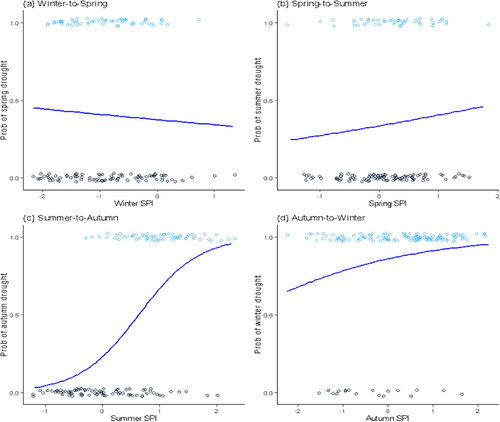
Figure 14. Odds ratio for various seasons in the selected stations. The bold form stations are significant at 1%.
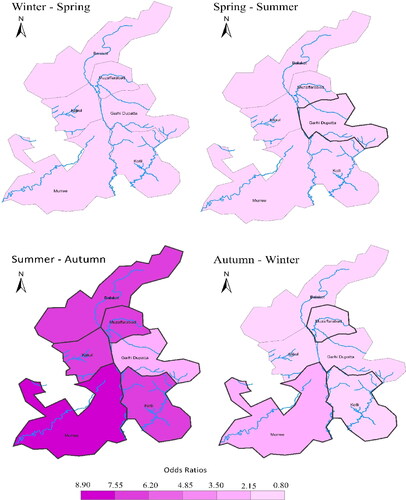
Table 6. Estimated coefficients, odds ratios (OR), standard errors (SE) of estimates, and 99% credible intervals (CI) of odds ratios obtained from Bayesian logistic regression models for inter-seasonal combinations at all the selected stations.