
Figures & data
Figure 1. Location of the study area on Ordos Plateau, China.
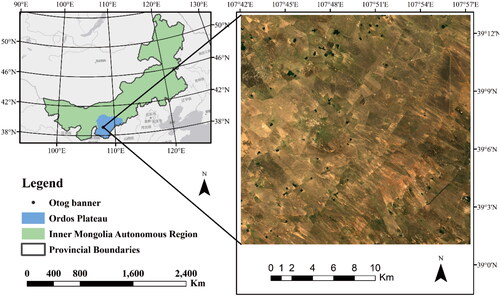
Table 1. Sample plots distribution and the numbers of gerbil holes.
Table 2. Image object information on brightness, spectral and geometric features.
Figure 2. Process of gerbil hole identification and optimization based on UAV imagery.
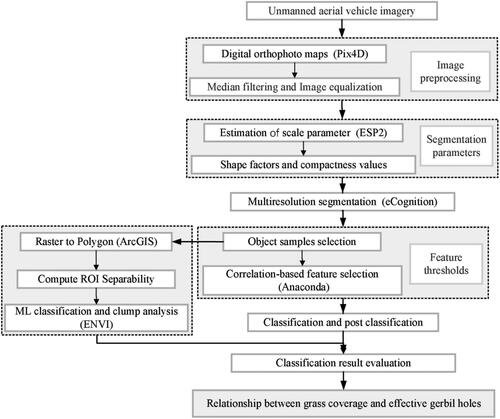
Figure 3. ESP tool outputs for the UAV imagery Graphs depict changes in local variance (LV) (solid black) and rate of change (ROC) (solid blue) with increasing scale parameter.
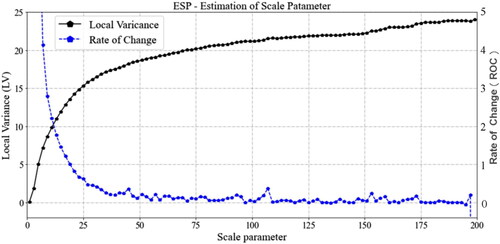
Figure 4. Segmentation results of UAV imagery under different scale parameters.
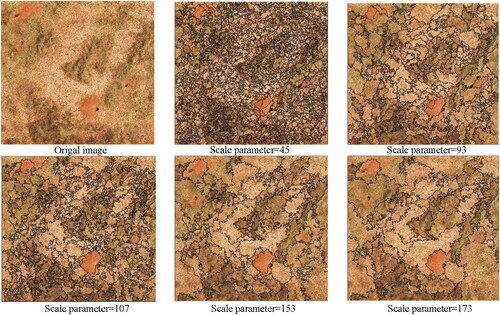
Figure 5. Segmentation results of gerbil holes under different shape factors.
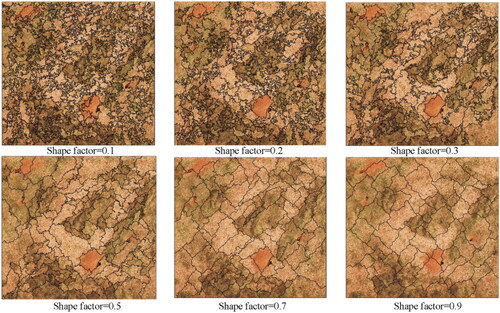
Figure 6. Segmentation results of gerbil hole under different compactness values.
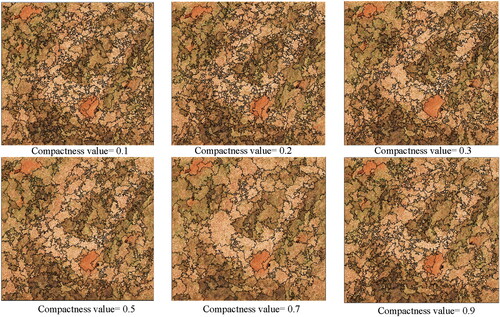
Table 3. Correlation-based forward search process.
Figure 7. Scatter plot of the distribution between optimal feature subset.
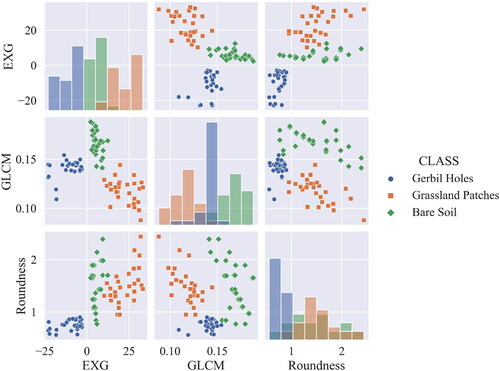
Figure 8. Classification results of UAV imagery based on spectral features, texture features and geometric features.
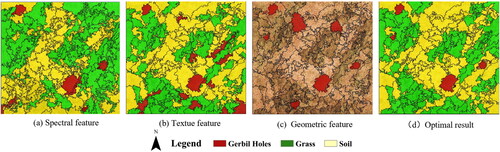
Table 4. Recommended parameters for identifying effective gerbil holes in OBIA.
Figure 9. Maximum likelihood classification result with post classification.
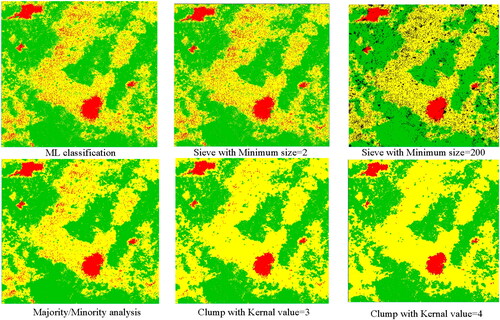
Figure 10. UAV imagery and partly enlarged detail of classification results. (a) UAV imagery of an entire sample plot, (b) Subset of UAV imagery, (c) OBIA result of subset, (d) ML classification result of subset, (e) OBIA with post classification and (f) MLC with post classification
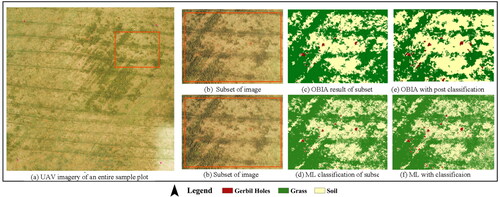
Table 5. Accuracy assessments of two methods.
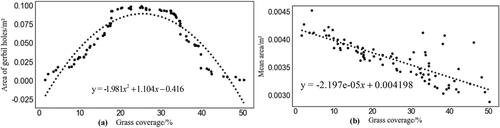
Figure 11. Relationship between grass coverage and area of effective gerbil holes. (a) Area of gerbil holes and (b) Mean area.
Data availability statement
The data that support this study was shared on ScienceDB (scidb.cn).