
Figures & data
Figure 1. The neighborhood shape definition tool, and a case of defining the neighborhood weights and effects. For example, for land-use transition to type B, the weights for types A, B, C and D are w1, w2, w3, and w4, respectively. In a 3 × 3 square neighborhood, the total effects for type B are (3w1+3w2+w3+2w4)/8.
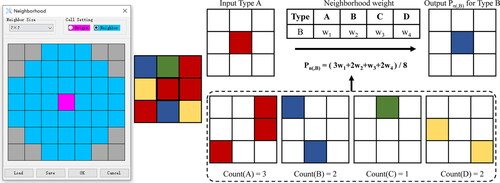
Figure 2. The definition of the transformation cost between any two land-use types.
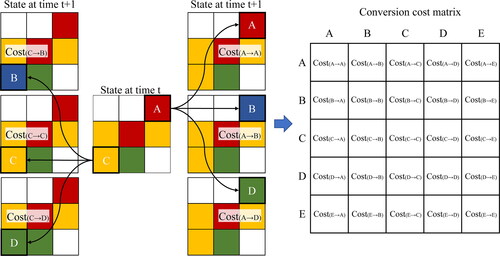
Figure 3. The processing of edge enhancement in the Futureland model.
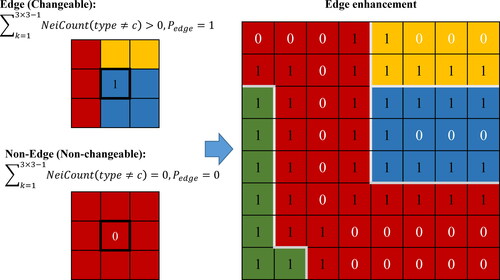
Table 1. The definition of assessment metrics of CA models and results.
Figure 4. The study area of Shanghai: (a) Ecological spatial plan (2017–2035); (b) Land-use pattern in 2010.
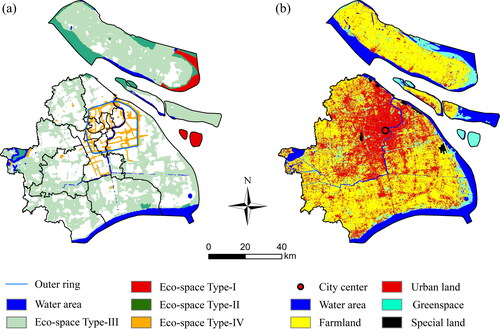
Table 2. Land-use classification criteria and definitions in the Shanghai study area.
Table 3. Remote sensing images and geographical information data used in this study.
Figure 5. Futureland for complex land-use change simulation and future scenario projections.
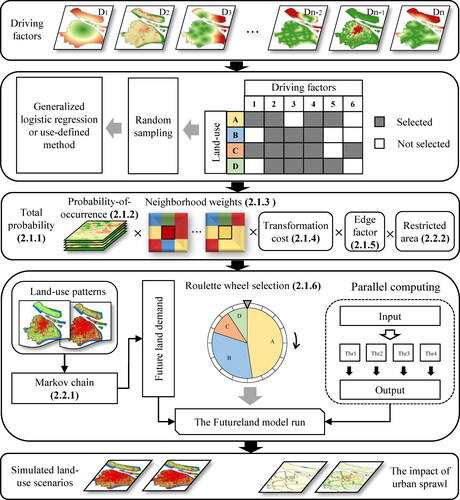
Figure 6. The probability-of-occurrence maps for the five land-use types in Shanghai.
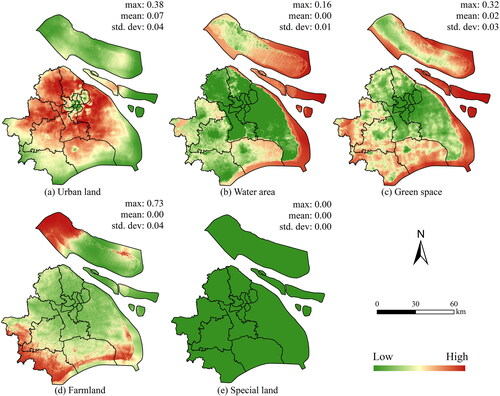
Figure 7. The simulated land-use patterns for 2015 and 2020 in comparison to the actual patterns.
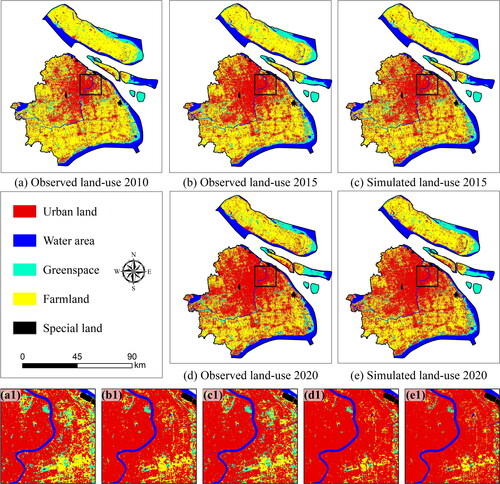
Figure 8. Future land-use scenarios of Shanghai in 2025 to 2035 projected using Futureland.
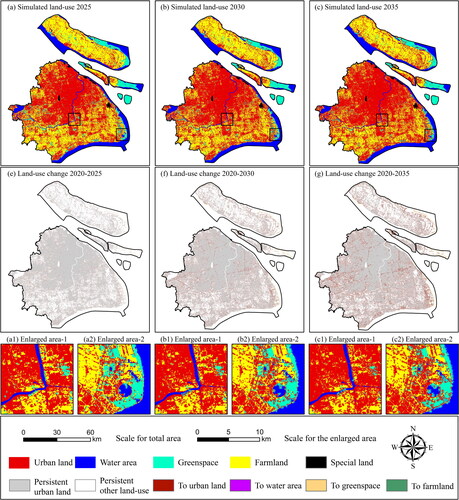
Table 4. The coefficients of the factors tested for statistical significance.
Table 5. The definition of the neighborhood weight matrix.
Table 6. The definition of the transformation cost matrix.
Table 7. The quantitative assessment of the simulated results for both calibration and validation.
Table 8. Total land demand in 2025, 2030 and 2035 based on modified Markov chain for Shanghai.
Figure 9. Buffer-based analysis of urban sprawl on farmland and greenspace in 2025, 2030, and 2035.
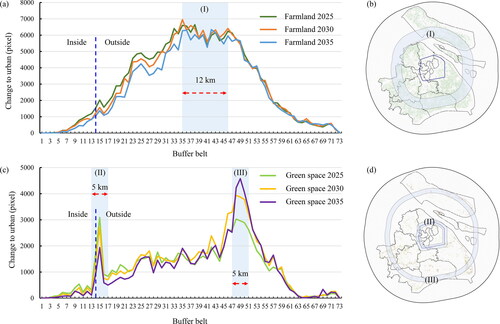
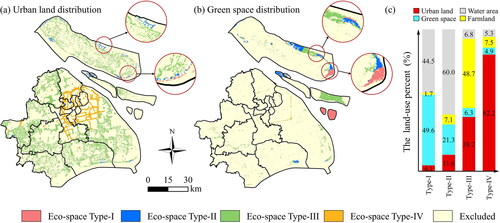
Figure 10. Urban land and greenspace scenarios for 2035. (a) Urban land scenario associated with the four eco-space types in urban planning; (b) greenspace scenario associated with the four eco-space types; (c) the proportion of land-use types associated with the four eco-space types.
Data availability statement
The Futureland software we developed is available at www.researchgate.net/publication/356978377 and the data we used is available at figshare.com/s/af1c7c14170fc44c39eb.