Figures & data
Figure 1. The GPHANet architecture for hyperspectral image classification.
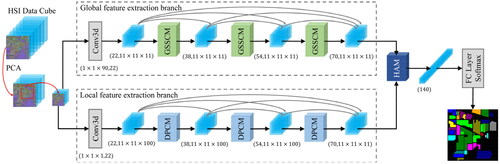
Figure 2. The structure of GSSCM.
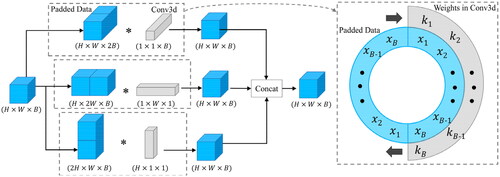
Figure 3. The structure of DPCM.
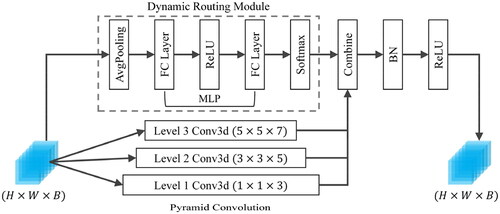
Figure 4. The structure of HAM.
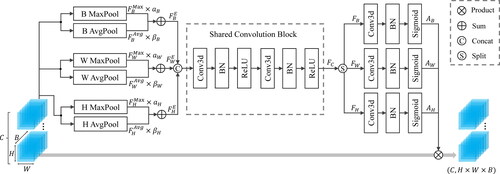
Figure 5. False-colour composition and the ground truth of the PU dataset.
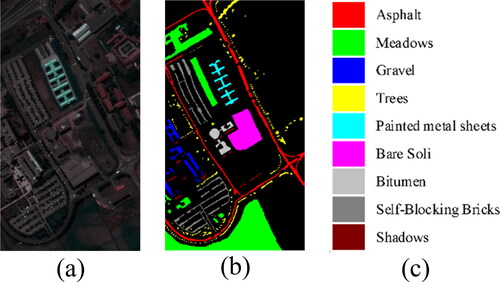
Figure 6. False-colour composition and the ground truth of the SA dataset.
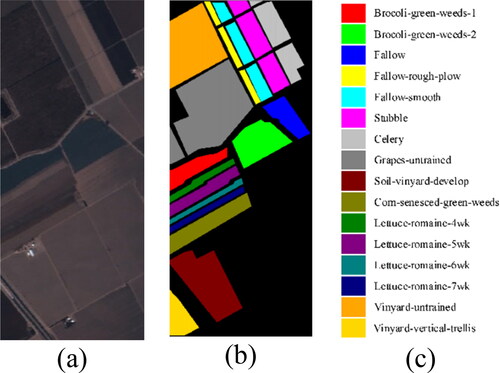
Figure 7. False-colour composition and the ground truth of the HO dataset.
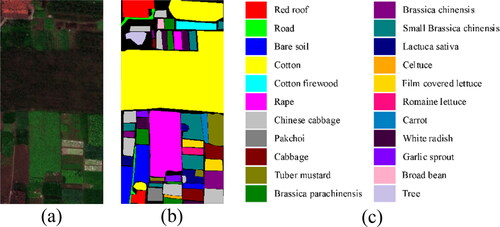
Figure 8. The impact of the patch size on GPHANet is evaluated on three datasets.
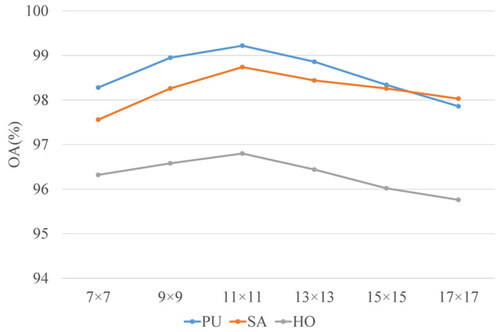
Figure 9. The impact of the principal components on GPHANet is evaluated on three datasets.
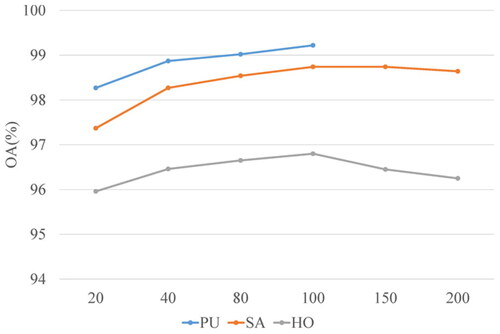
Figure 10. Visual comparison on the PU dataset: (a) Ground-truth, (b) SVM, (c) CDCNN, (d) SSRN, (e) DBDA, (f) DCRN, (g) SSFTT, (h) GPHANet.
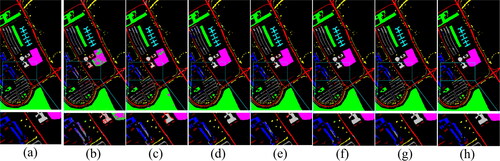
Table 1. Classification results of seven methods on the PU dataset.
Figure 11. Visual comparison on the SA dataset: (a) Ground-truth, (b) SVM, (c) CDCNN, (d) SSRN, (e) DBDA, (f) DCRNet, (g) SSFTT, (h) GPHANet.
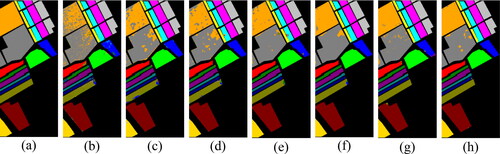
Figure 12. Visual comparison on the HO dataset: (a) Ground-truth, (b) SVM, (c) CDCNN, (d) SSRN, (e) DBDA, (f) DCRN, (g) SSFTT, (h) GPHANet.
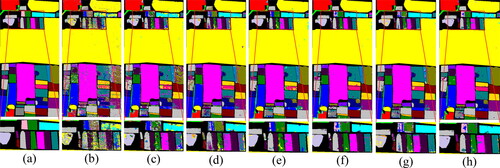
Table 2. Classification results of seven methods on the SA dataset.
Table 3. Classification results of seven methods on the HO dataset.
Table 4. The testing time (s) between different methods on three datasets.
Figure 13. The effectiveness of GSSCM on three datasets, (a) PU, (b) SA, (c) HO.
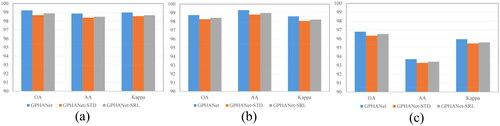
Figure 14. The effectiveness of DPCM on three datasets, (a) PU, (b) SA, (c) HO.
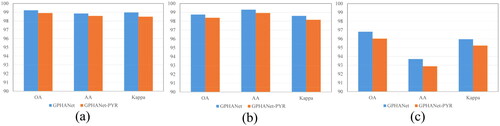
Figure 15. The effectiveness of HAM on three datasets, (a) PU, (b) SA, (c) HO.
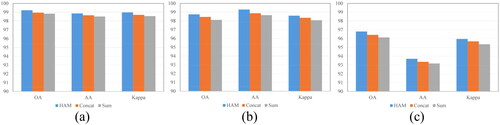
Figure 16. Visualization of the feature maps generated before and after HAM.
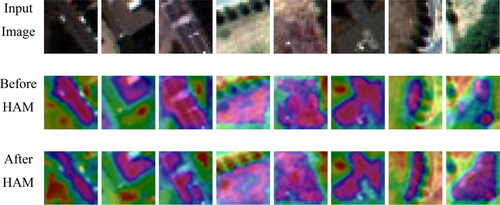
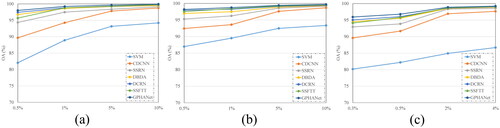
Figure 17. OA results of seven methods under different proportions of training samples: (a) PU, (b) SA, (C) HO.