
Figures & data
Figure 1. Flow chart of the methodology and technical approach.
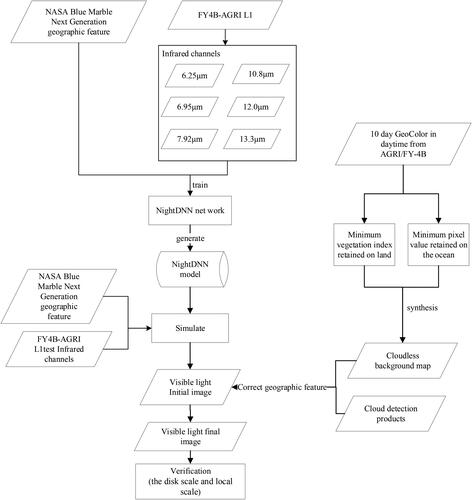
Table 1. FY-4B/AGRI L1B data information.
Table 2. Non-night partial longitude reservation range.
Figure 2. Blue Marble Next Generation base map.
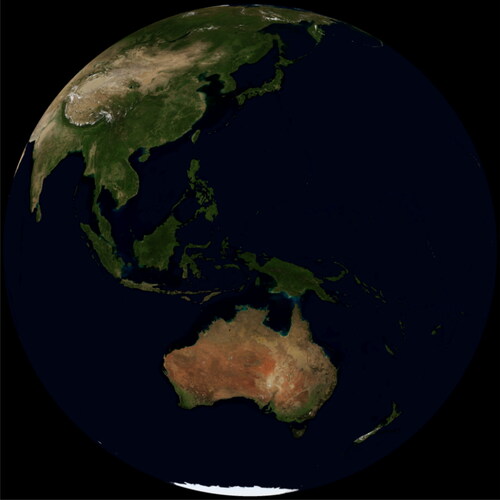
Table 3. Specific parameters and main applications of all FY-4B AGRI bands.
Figure 3. NightDNN Network topology.
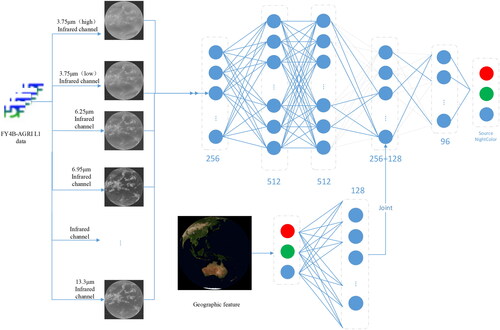
Figure 4. Loss and MAE curves during NightDNN training.
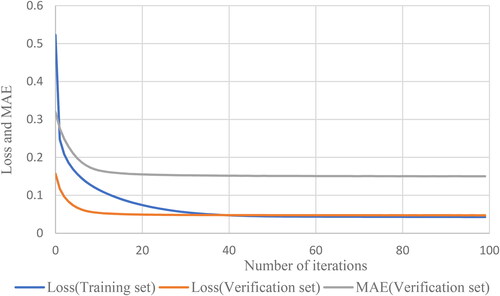
Figure 5. Comparison of FY-4B/AGRI GeoColor images and visible bands simulated with different infrared band combinations at three times on 20220905. (combination 1: x_r + x_g + x_b + C7 + C8; combination 2: x_r + x_g + x_b + C9 + C10 + C11; combination 3: x_r + x_g + x_b + C13 + C14 + C15; combination 4: x_r + x_g + x_b + C12;combination 5: x_r + x_g + x_b + C12 + C13 + C14 + C15; combination 6: x_r + x_g + x_b + C9 + C10 + C11 + C13 +C14 + C15).
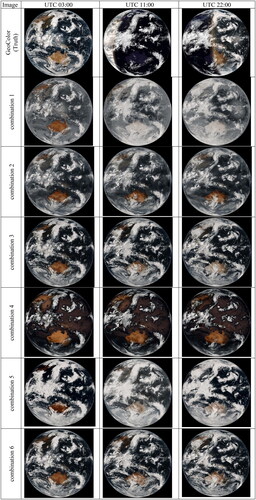
Figure 6. Synthetic clear-sky background map data from FY-4B/AGRI as the background map.
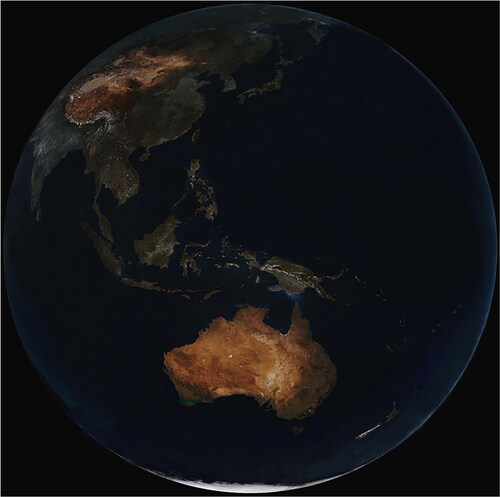
Figure 7. Observed visible band and the simulated visible band of FY-4B/AGRI true colour images on 20220905 at 03:00, 17:00 and 22:00 UTC.
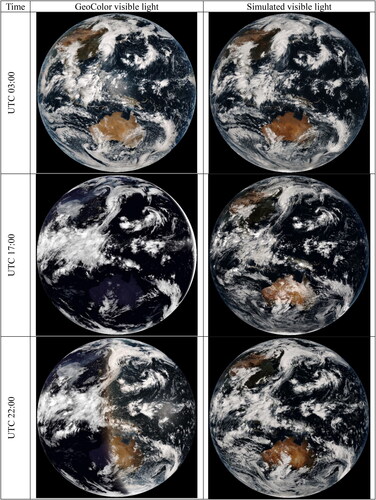
Figure 8. Observed FY-4B/AGRI true colour images of Southern Hemisphere region and the corresponding simulated images at different times on 20220905.
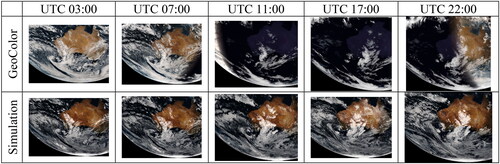
Figure 9. Observed FY-4B/AGRI true colour images and the corresponding simulated images of Typhoon Xuanlano at different times on 20220905: (a) GeoColor visible light images of typhoon area and (b) simulated visible light images of typhoon area.
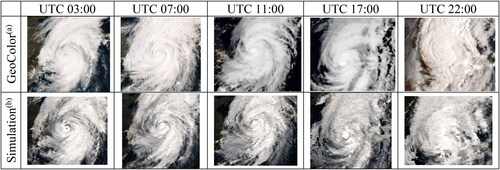
Figure 10. Medium–low clouds in (left) FY-4B/AGRI true colour image and (right) simulated low clouds on 20220905 at 22:00 UTC.
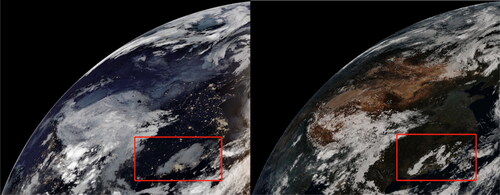
Figure 11. FY-4B/AGRI true colour image and the corresponding simulated image for flare at 22:00 UTC on 20220905.
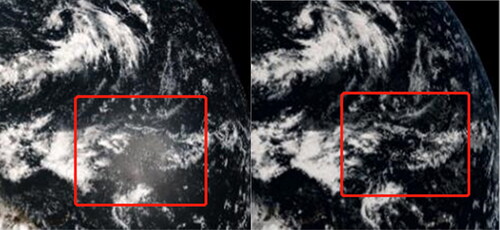
Table 4. Fitting results of simulated visible light and corresponding GeoColor visible light.
Table 5. Weight of each input band in the model.
Data availability statement
The datasets available from the corresponding author on reasonable request.