
Figures & data
Figure 1. Topography map and location of the central Himalayas (the digital boundary of the GRB from (Nie et al. Citation2017) and Tibetan Plateau from (Zhang et al. Citation2021).
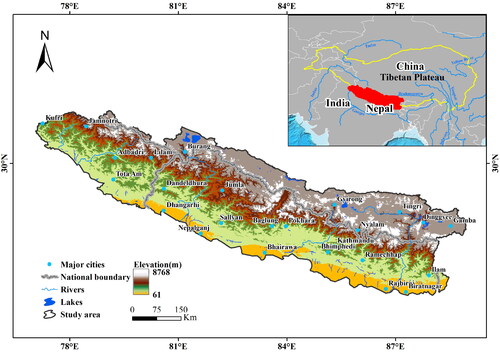
Table 1. Datasets used in this study.
Figure 2. The flow chart to generate forest disturbance recovery mapping and influencing factors analysis, which includes (a) annual forest probability estimation module, (b) forest disturbance and recovery change mapping module, (c) forest spatial and temporal evolution analysis module and (d) analysis of factors influencing changes in forest dynamics module.
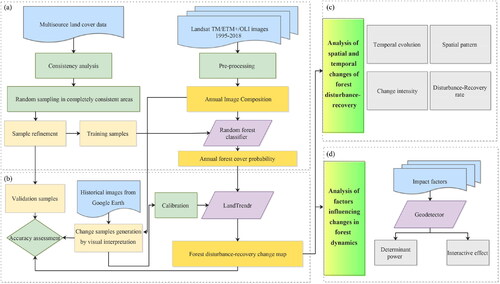
Table 2. Interaction categories of two factors and the interaction relationship.
Table 3. Accuracy assessment of forest change detection for each period.
Figure 3. Annual forest disturbance-recovery area changes and cumulative percentage from 1995 to 2018.
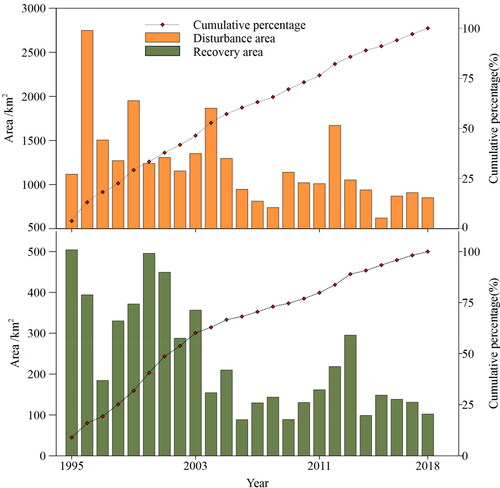
Figure 4. Spatial patterns of transboundary forest disturbance-recovery in each detection period. (a) 1995–2018, (b) 1995–2003, (c) 2004–2011, (d) 2012–2018.
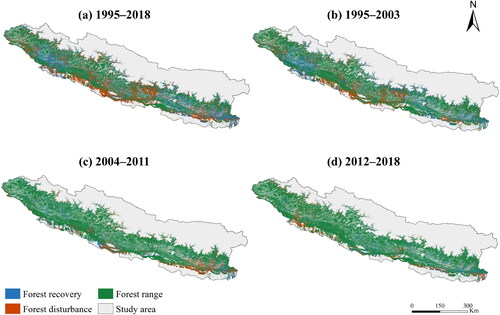
Figure 5. Annual disturbance and recovery rates of forests in India, Nepal, and China for each detection period. (a) Forest disturbance rate; (b) forest recovery rate.
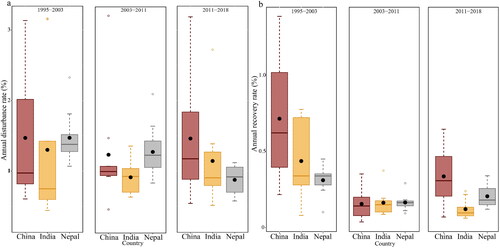
Figure 6. Forest change intensity at the district level in the study area between 1995 and 2018. DD: Dehra dun; TG: Tehri Garhwal; RP: Rudra prayag; PG: Pauri Garhwal; BS: Bageshwar; CP: Champawat; UN: Udham Singh Nagar. The intensity of change (P) was divided into five categories: extremely low (p ≤ 1.44), low (1.44 < p ≤ 1.63), medium (1.63 < p ≤ 1.84), high (1.84 <p ≤ 2.7), extremely high (p ≥ 2.7).
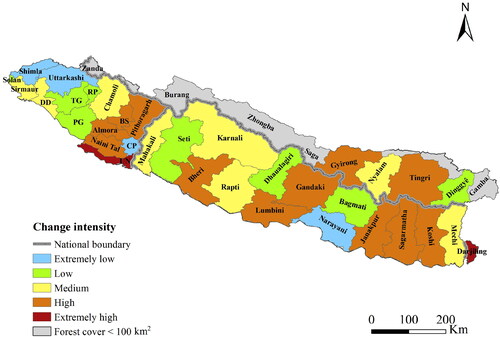
Figure 7. PD values of the influencing factors from 1995 to 2018 in the transboundary forest. All PD values were statistically significant at the 1% level. The error bars represent the 1 – σ uncertainty. MXT: annual maximum temperature; MNT: annual minimum temperature; PRE: annual precipitation; DEM: elevation; ASP: aspect; POP: population density; RDD: distance to roads; RAD: distance to residential areas; RVD: distance to rivers.
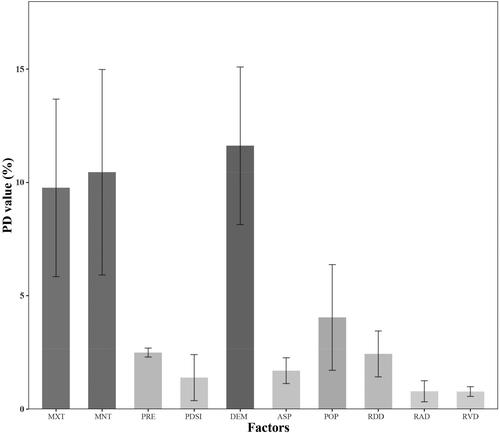
Figure 8. Interaction effects of factors influencing transboundary forest dynamic change in each detection period. (a) 1995–2003; (b) 2004–2011; (c) 2012–2018; MXT: annual maximum temperature; MNT: annual minimum temperature; PRE: annual precipitation; DEM: elevation; ASP: aspect; POP: population density; RDD: distance to roads; RAD: distance to residential areas; RVD: distance to rivers.
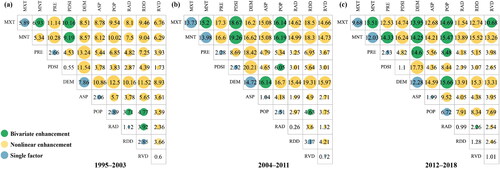
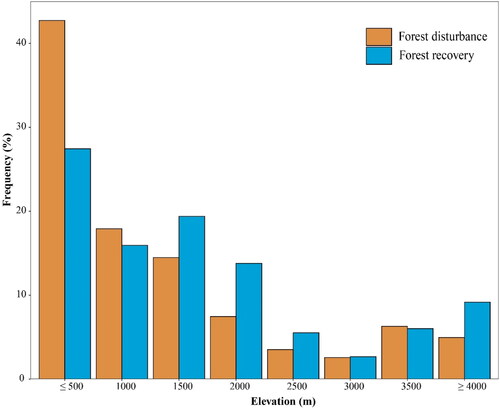
Figure 9. Occurrence frequency of transboundary forest disturbance and restoration along elevation gradient from 1995 to 2018 in the central Himalayas.
Supplemental Material
Download MS Word (402.7 KB)Data availability statement
The data that support the findings of this study are available from the corresponding author, upon reasonable request.