
Figures & data
Figure 1. Map of study landscape.
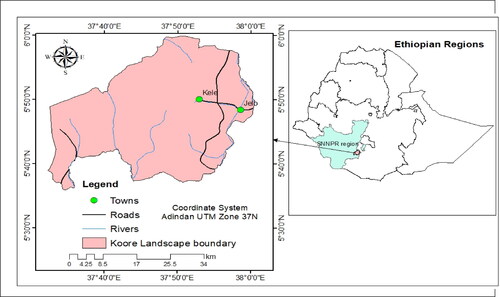
Table 1. Contextual description of the LULC classes.
Table 2. Kappa index CA-Markov model validation result.
Figure 2. Methodological flow chart of LULC change detection and modeling.
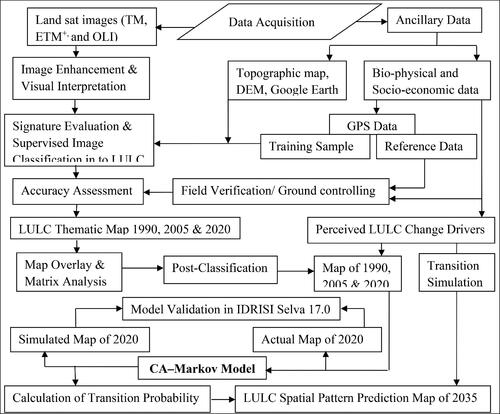
Table 3. Accuracy assessment results of classified images.
Table 4. LULC classes and their changed shares in 1990, 2005 and 2020.
Figure 3. LULC Maps of 1990 (a), 2005 (B), and 2020 (C).
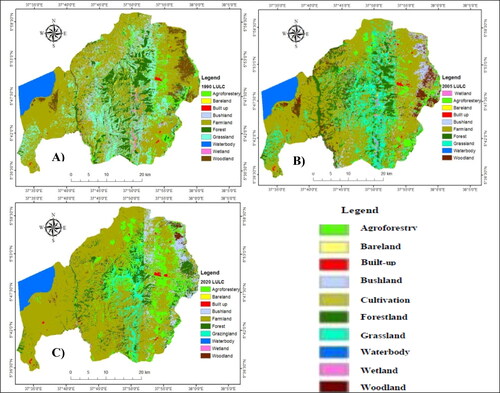
Figure 4. Suitability maps of spatial drivers.
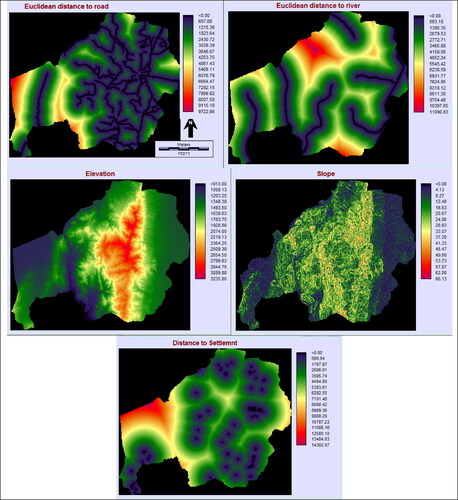
Table 5. LULC change statistics (in hectares).
Table 6. LULC change transition matrix of 1990–2005 in hectares.
Table 7. LULC change transition matrix of 2005–2020 in hectares.
Table 8. LULC change transition matrix of 1990–2020 in hectares.
Table 9. Identified potential LULC change drivers of the landscape.
Table 10. Driver factors and their weight.
Figure 5. A = Actual LULC map of 2020, B = simulated LULC map of 2020, and C = predicted LULC map of 2035.
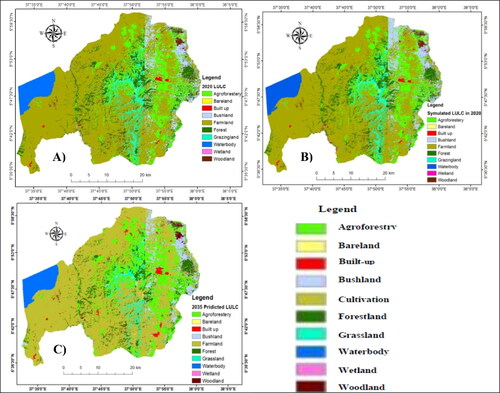
Table 11. Kappa index result of the model validation.
Table 12. Actual and simulated LULC changes in 2020.
Table 13. LULC area coverage, its Percent, and rate of changes between 2020 and 2035.
Figure 6. A = 1990, 2005, 2020, and 2035 coverage of LULC classes; B = Net change of past three decades; C = net change of LULC classes over prediction period.
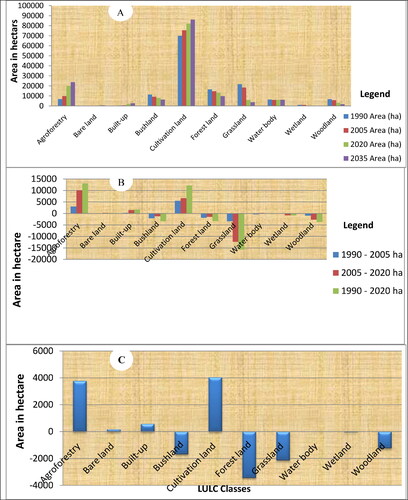
Table 14. LULC change transition matrix of 2020–2035 in hectares.
Figure A1. A = Map of 1990, B = map of 2005, C = map of 2020.
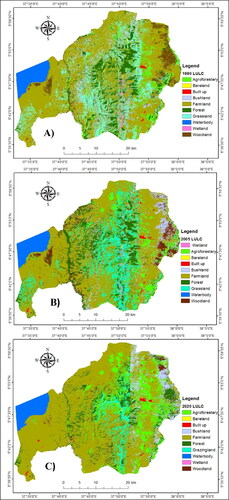
Figure B1. A = Actual LULC map of 2020, B = simulated LULC map of 2020, and C = predicted LULC map of 2035.
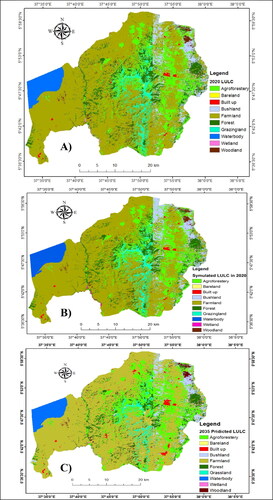
Table C1. LULC accuracy assessment in 1990.
Table C2. LULC accuracy assessment in 2005.
Table C3. LULC accuracy assessment in 2020.
Data availability statement
The data that has been used is confidential. All landsat images were acquired from the United States Geological Survey (USGS) website available at (https://earthexplorer.usgs.gov).