
Figures & data
Figure 1. Map of the study showing the location of the survey households and zones with relatively similar rainfall patterns. The rainfall zones were generated from long-term (2014–2020) aggregation of annual TerraClimate satellite rainfall estimates.
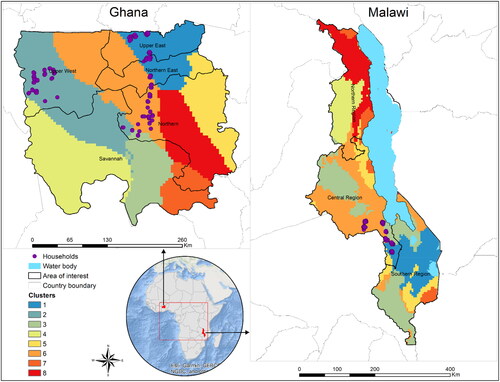
Figure 2. The average Palmer Drought Severity Index (PDSI) values for the growing seasons of Malawi and Ghana in 2013–2014 and 2018–2019. The growing season for Ghana spans from April to October, while for Malawi, it takes place between October and April of the following year.
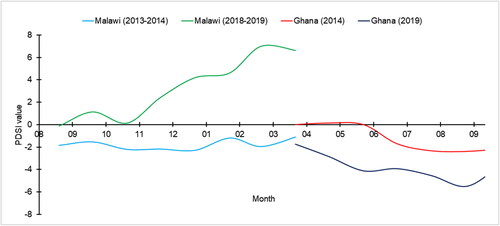
Table 1. Variables used in the models.
Table 2. Gridded environmental and weather data used in the model.
Figure 3. Boxplots showing the distribution of the maize yield data for Ghana and Malawi with (a) and without (b) outliers were removed. The blue text is the number of households per cluster. The clusters are as described in .
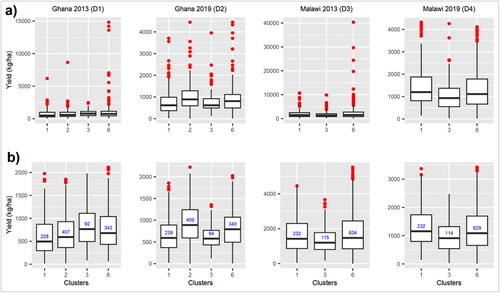
Table 3. The number of retained predictor variables after the VSURF thresholding step.
Table 4. Model performance metrics when all predictors were used and when only the categorical household survey was used.
Figure 4. Variable importance and partial dependence plots for Ghana in 2013. (a) and (b) All predictor and categorical variables importance plots respectively. (c) and (d) Partial dependence plots for the top 6 predictors with all predictors and only with categorical variables respectively.
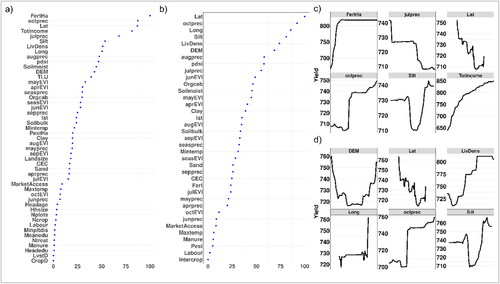
Figure 5. Variable importance and partial dependence plots for Ghana in 2019. (a) and (b) All predictor and categorical variables importance plots respectively. (c) and (d) Partial dependence plots for the top 6 predictors with all predictors and only with categorical variables respectively.
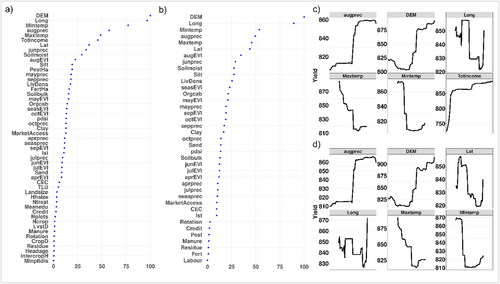
Figure 6. The spatial maize yield prediction and yield gain for Ghana in 2013 and 2019 when fertilizer use was incorporated as a useful agronomic practice. (a) When no agronomic practice was used. (b) Fertilizer use and (c) yield gain/loss ( – ).
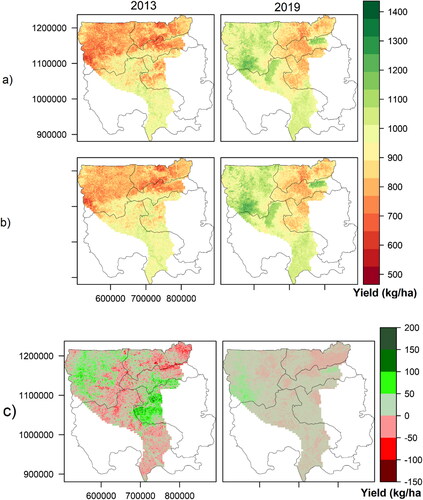
Figure 7. Variable importance and partial dependence plots for Malawi in 2013. (a) and (b) All predictor and categorical variables importance plots respectively. (c) and (d) Partial dependence plots for the top 6 predictors with all predictors and only with categorical variables respectively.
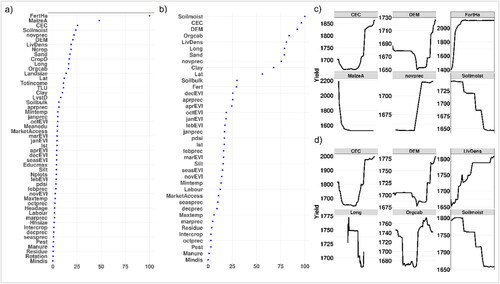
Figure 8. Variable importance and partial dependence plots for Malawi in 2019. (a) and (b) All predictor and categorical variables importance plots respectively. (c) and (d) Partial dependence plots for the top 6 predictors with all predictors and only with categorical variables respectively.
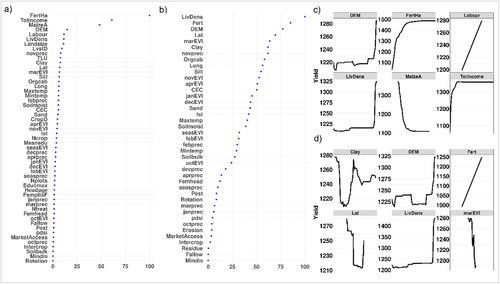
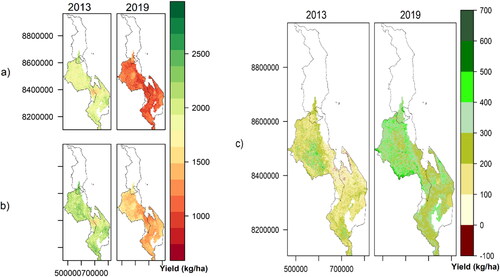
Figure 9. The spatial maize yield prediction and yield gain for Malawi in 2013 and 2019 when fertilizer use was incorporated as a useful agronomic practice. (a) When no agronomic practice was used. (b) Fertilizer use and (c) yield gain/loss ( – ).
Data availability statement
All the R programming scripts and excel files used in fitting the models are available in github repository (https://github.com/Muthono19/Predicting-Maize-Yield-in-Ghana-and-Malawi.git). The remote sensing data used is open source and can be downloaded through GEE.