Figures & data
Figure 1. Simplified neotectonics and geologic settings of the Kabul Block and surroundings; A) the orogenic segments and structural settings of Afghanistan and Kabul Block modified after (Wheeler et al. Citation2005; Abdullah et al. Citation2008; Siehl Citation2017), B) The simplified geological map of the Kabul Block adapted after (Abdullah et al. Citation2008; Ahmadi and Uygucgil Citation2021), with major faults indicated by red lines from (Ruleman et al. Citation2007; Abdullah et al. Citation2008). fault segments represented by black lines have been adapted from (Ahmadi et al. Citation2022).
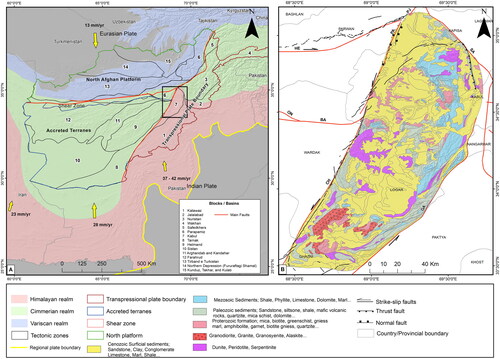
Figure 2. Flowchart showing the entire procedure of the methodology.
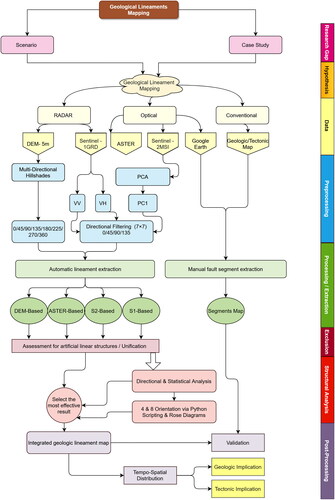
Figure 3. Generated shaded relief images from DEM-5m after the azimuthal filter into eight directions: A) 00°, B) 45°, C) 90°, D) 135°, E) 180°, F) 225°, G) 270°, and H) 315°.
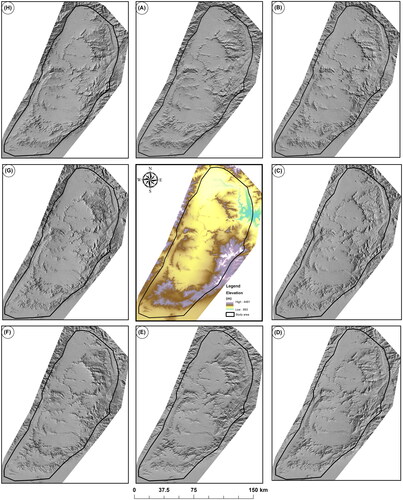
Figure 4. Sentinel-1B GRD with VV polarization after Prewitt filter in four directions A) 00° (N-S), B) 45° (NE-SW), C) 90° (E-W), and D) 135° (NW-SE), Sentinel 1B GRD with VH polarization after Prewitt filter into four directions A) 00° (N-S), B) 45° (NE-SW), C) 90° (E-W), and D) 135° (NW-SE).
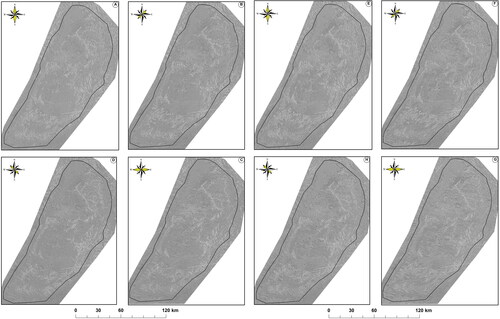
Figure 5. PC1 of Sentinel-2A MSI data after directional filtering into four directions A) 00° (N-S), B) 45° (NE-SW), C) 90° (E-W), and D) 135° (NW-SE), PC1 of ASTER data after directional filtering into four directions A) 00° (N-S), B) 45° (NE-SW), C) 90° (E-W), and D) 135° (NW-SE).
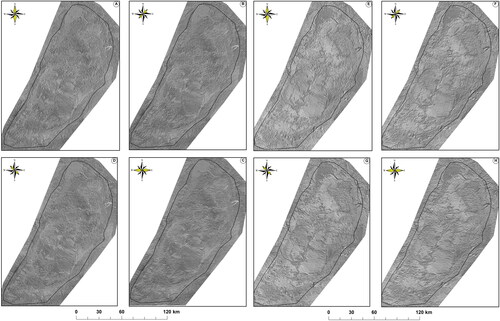
Figure 6. Orientation trends of the extracted lineaments from radar (DEM and Sentinel-1B GRD) and optical data (Sentinel-2A MSI and ASTER) into eight and four directions in the entire Kabul Block.
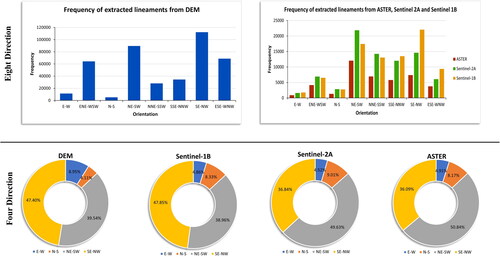
Figure 7. Distribution of lineaments and their orientation pattern in Zone-I extracted from radar data; a) DEM-5m and b) Sentinel-1B GRD.
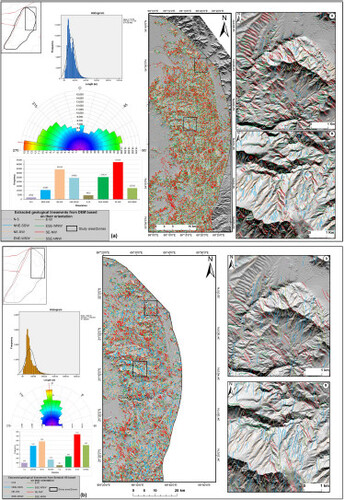
Figure 8. Extracted lineaments superimposed on shaded relief image in Zone-1 of Kabul Block with their spatial pattern based on optical data a) Sentinel-2A MSI and b) ASTER.
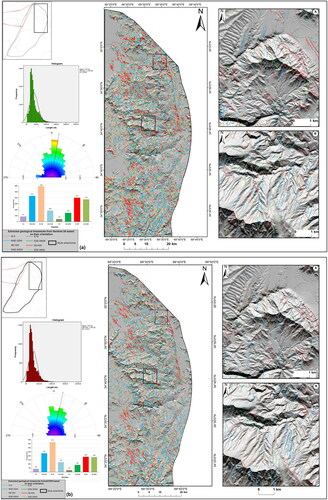
Table 1. The brief statistics of the extracted geological-based lineaments from radar and optical data over the entire Kabul Block.
Figure 9. Distribution of the extracted lineaments within the Zone-II of Kabul Block from; a) DEM-5m and b) Sentinel-1B GRD.
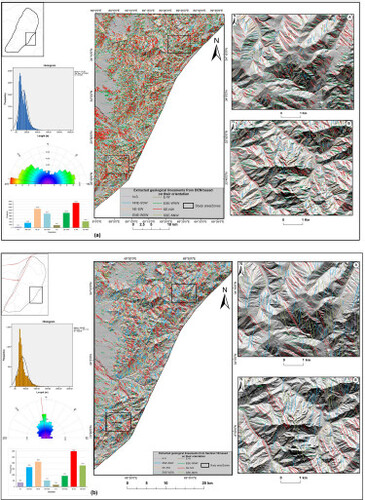
Figure 10. Distribution of the extracted lineaments within the Zone-II of Kabul Block from; a) Sentinel-2A MSI and b) ASTER.
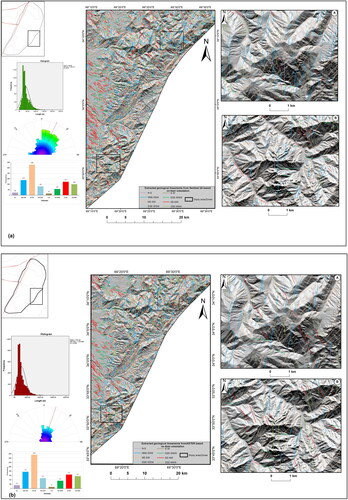
Figure 11. Distribution of extracted lineaments superimposed on hill-shade images within Zone-III and their associated magnified areas from a) DEM-5m and b) Sentinel-1B GRD.
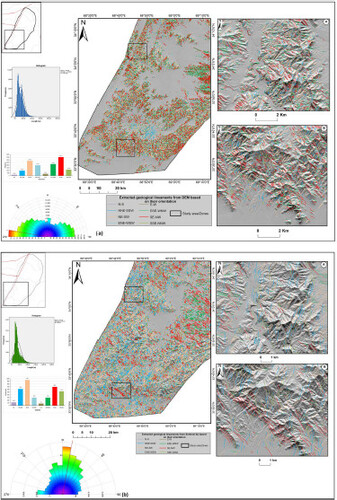
Figure 12. Distribution of extracted lineaments superimposed on hill-shade images within Zone-III and their associated magnified areas from: a) Sentinel-2A MSI and b) ASTER.
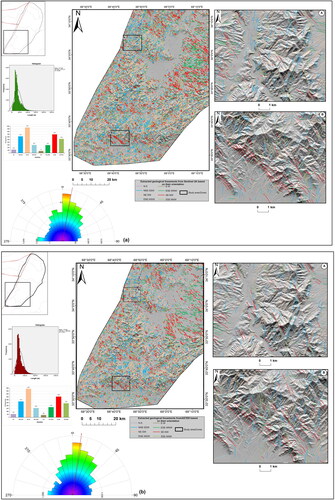
Table 2. Summary of the descriptive statistics of the detected lineaments over the zones I-II-III-IV from radar and optic data.
Figure 13. Superimposition of the detected lineaments with their spatial patterns on a shaded relief map over the Zone-IV generated from: a) DEM-5m and b) Sentinel-1B GRD.
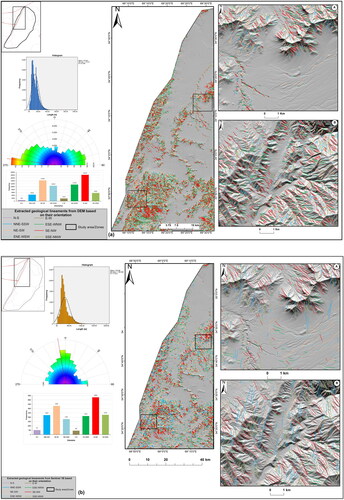
Figure 14. Spatial pattern and distribution of detected lineaments overlayed on hill-shade images from: a) Sentinel-2A MSI and b) ASTER.
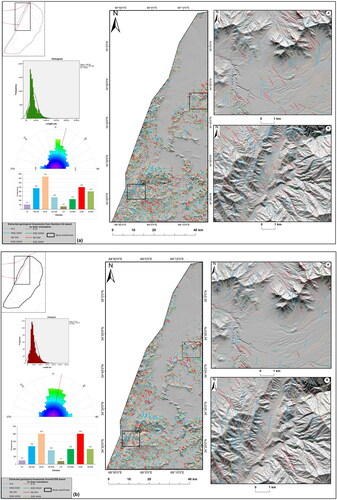
Figure 15. Linear regression plot for the correlation analysis of the detected lineaments from radar (DEM-5m and Sentinel-1B GRD) and optical (Sentinel-2A MSI and ASTER) data.
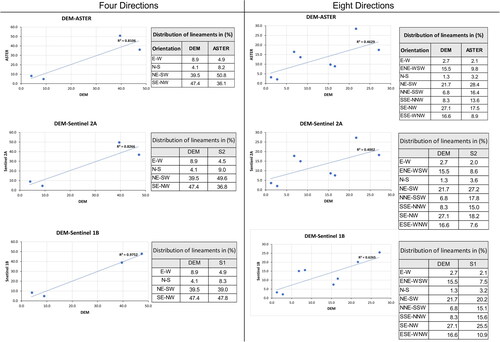
Figure 16. Thematic map showing the spatial density of lineaments superimposed by active fault segments: black fault lines from (Ahmadi et al. Citation2022), and light Blue fault lines are from (Wheeler et al. Citation2005; Abdullah et al. Citation2008).
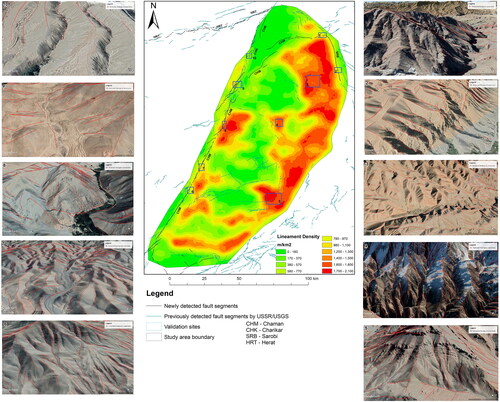
Figure 17. Thematic maps showing the tempo-spatial analysis of the lineament trends over the Kabul Block; a) Zone-I, b) Zone-II, c) Zone-III, d) Zone-IV, and e) overall statistics.
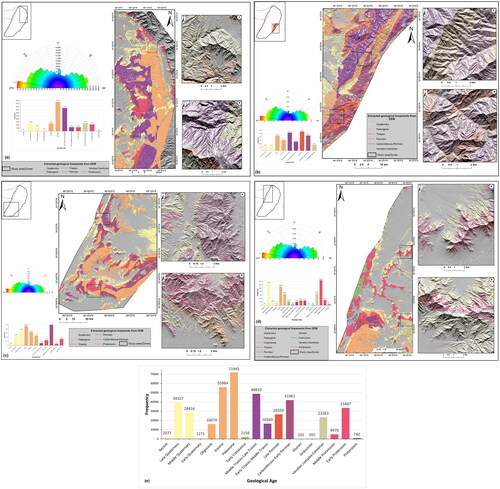
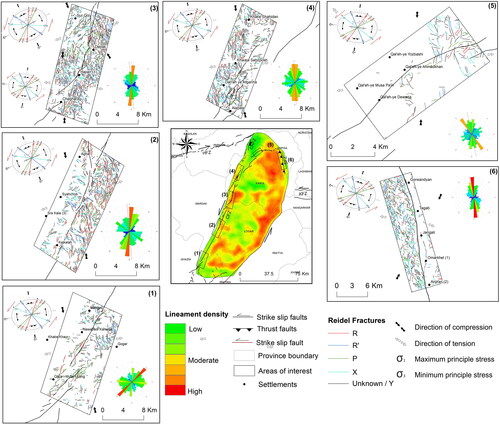
Figure 18. Interpretation of strain ellipse and Riedel shear mechanism model in the western, southwestern, northern, and south-eastern regions of the Kabul Block; R, synthetic Riedel shears; R', antithetic Riedel shears; P, secondary synthetic Riedel shears; X, secondary antithetic Riedel shears.