
Figures & data
Figure 1. The study area and its DEM.
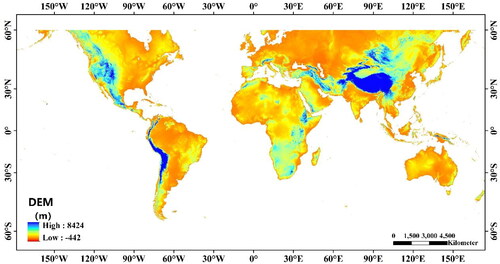
Figure 2. Thematic map of the lithological factor.
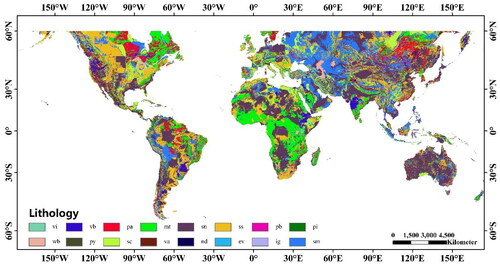
Table 1. Lithology abbreviation in .
Figure 3. Thematic map of the precipitation factor.
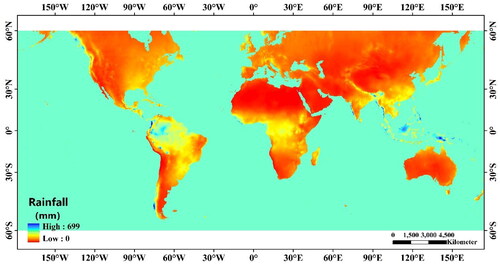
Figure 4. Thematic map of the faults distance factor.
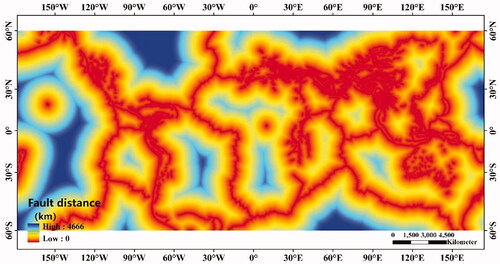
Figure 5. Global landslide inventory map.
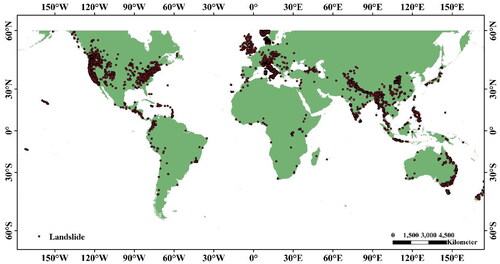
Table 2. Datasets for global LSP.
Table 3. Datasets for regional LSP.
Figure 6. Schematic diagram of the proposed framework.
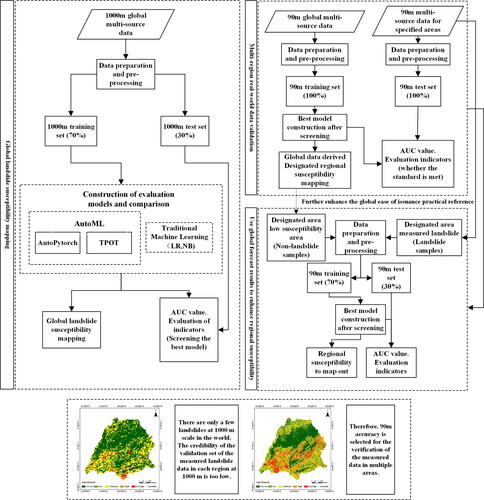
Table 4. Parameter settings for different methods of global landslide susceptibility.
Table 5. Parameter settings for Auto-PyTorch of regional landslide validation.
Table 6. Parameter settings for different methods of performance comparison at different training times.
Figure 7. ROC curves of different prediction methods.
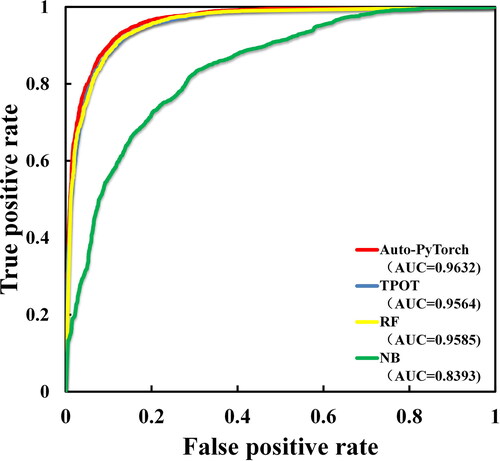
Table 7. Evaluation indications of different prediction methods.
Figure 8. Global landslide susceptibility map by Auto-PyTorch.
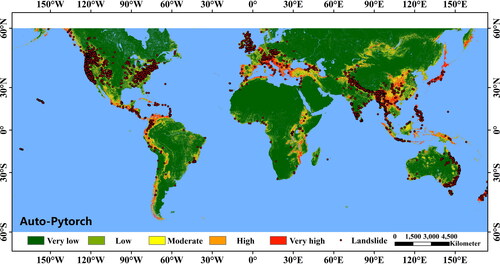
Figure 9. ROC curves of Auto-PyTorch.
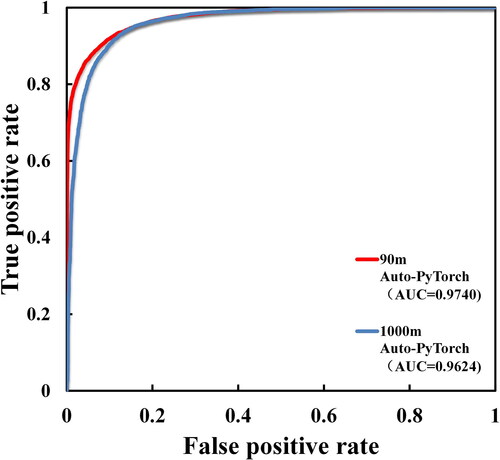
Table 8. Performance of Auto-PyTorch at different spatial resolution with a training time of 30 min.
Table 9. AUC values of different national datasets.
Figure 10. National landslide susceptibility maps by Auto-PyTorch. (a) and (d) Ireland, (b) and (e) Denmark, (c) and (f) Norway (part). the first line shows the results of Auto-PyTorch when the specified area is selected in the global LSP map., and the second line shows the results of Auto-PyTorch when non-landslide samples are selected from the low susceptible areas of the obtained global landslide susceptibility maps.
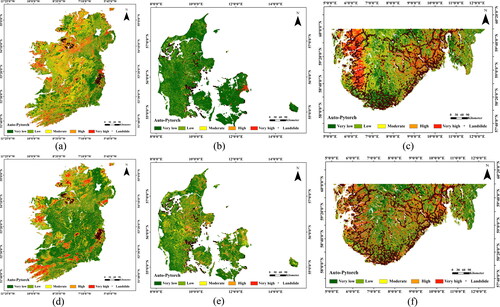
Figure 11. Provincial landslide susceptibility maps by Auto-PyTorch. (a) and (d) Veneto Province, Italy, (b) and (e) Apulia Province, Italy, (c) and (f) Shaanxi Province, China. The first line shows the results of Auto-PyTorch when the specified area is selected in the global LSP map, and the second line shows the results of Auto-PyTorch when non-landslide samples are selected from the low susceptible areas of the obtained global landslide susceptibility maps.
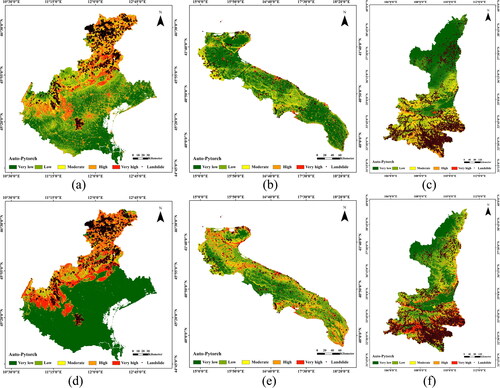
Table 10. AUC values of different provincial datasets.
Figure 12. Prefectural landslide susceptibility maps by Auto-PyTorch. (a) and (c) Yongxin County, China, (b) and (d) the earthquake zones of Hokkaido, Japan. The first line shows the results of Auto-PyTorch when the specified area is selected in the global LSP map, and the second line shows the results of Auto-PyTorch when non-landslide samples are selected from the low susceptible areas of the obtained global landslide susceptibility maps.
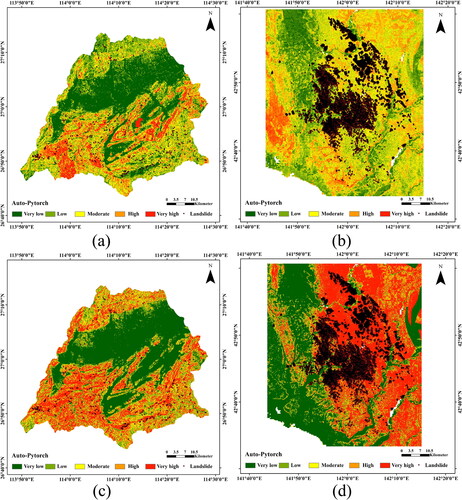
Table 11. AUC values of different prefectural datasets.
Figure 13. 1000m spatial landslide susceptibility map (Yongxin County, China).
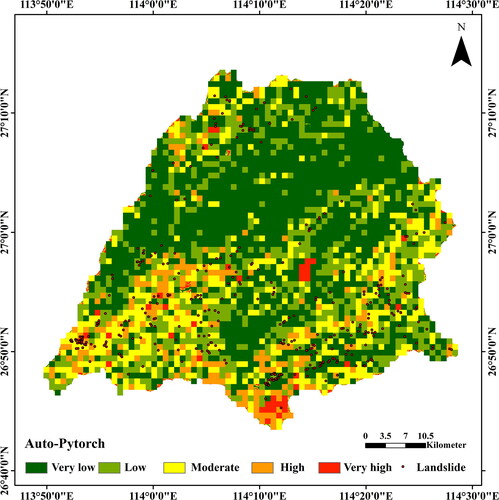
Figure 14. Evaluation indicators values over time over time for the two AutoML models and the RF model. (a) ACC, (b) AUC, (c) MAE and (d) RMSE.
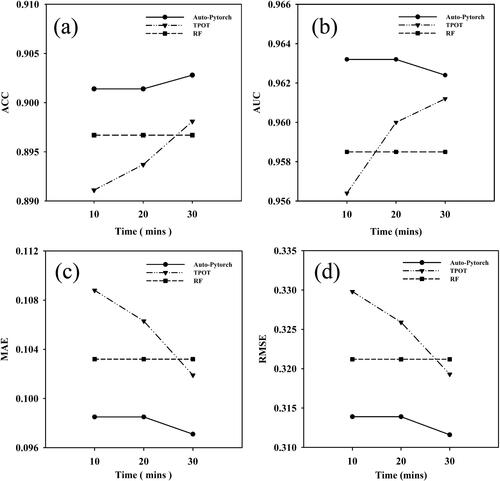
Table 12. Performance of two AutoML models under different training time.
Data availability statement
The data and codes are available upon request to the authors.