
Figures & data
Figure 1. Location of study area, with true colour composite map illustrating full extent of the study area.
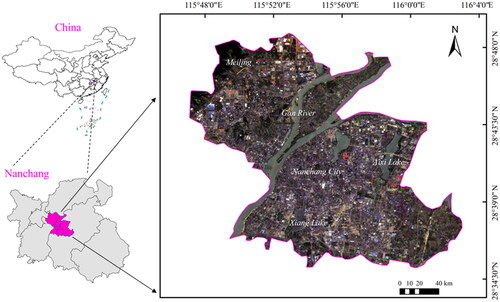
Table 1. Spectral bands of the GF-6 satellite.
Figure 2. The overall framework of the urban land use/land cover classifications using GF-6 imagery.
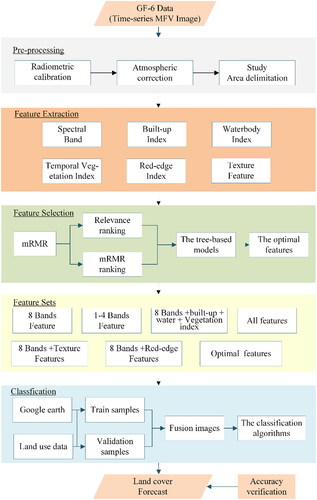
Table 2. Features extracted from GF-6 images.
Table 3. Experimental schemes for seven feature sets.
Figure 3. The classification process for Random Forests and Extreme Gradient Boosting.
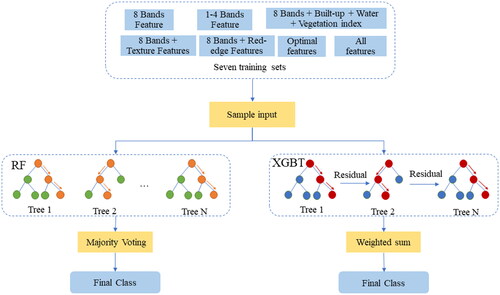
Figure 4. Relevance ranking based on mRMR algorithm. The horizontal axis represents the feature name. The vertical axis represents the relevance score of each feature.
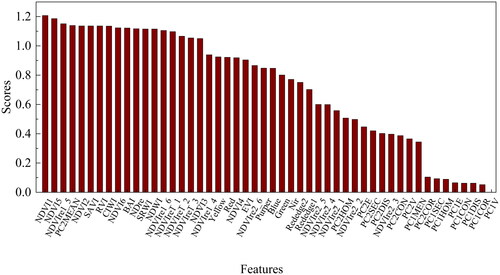
Figure 5. Max-relevance and min-redundancy ranking based on mRMR algorithm. The horizontal axis represents the feature name. The vertical axis represents the mRMR score of each feature.
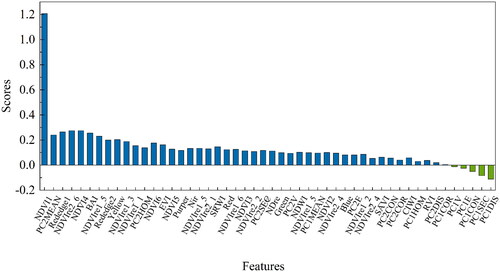
Figure 6. Relationship between number of features, OA and Kappa based on max-relevance and min-redundancy ranking for the two tree-based classifier.
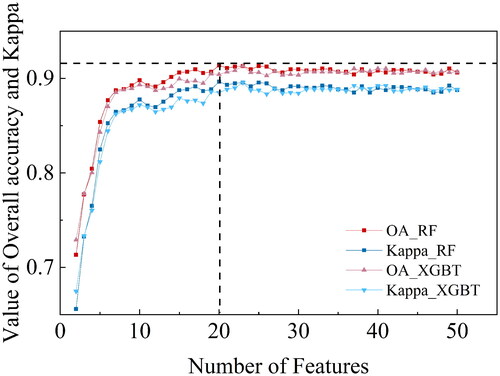
Figure 7. Relationship between number of features, OA and Kappa based on relevance ranking for the two tree-based classifier.
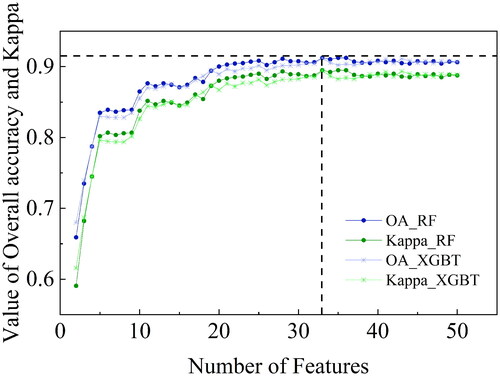
Figure 8. Classification results of seven feature schemes; the black rectangle is area 1, the black ellipse is area 2.
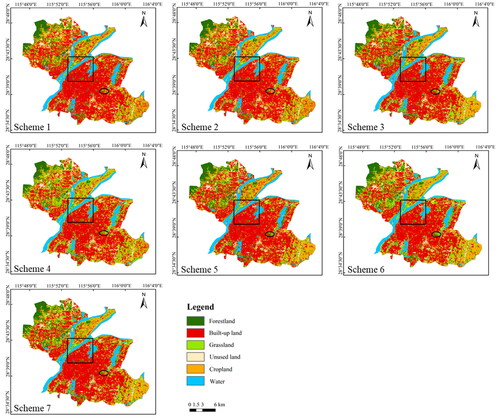
Figure 9. Comparisons of overall accuracy and Kappa derived from RF in different feature schemes.
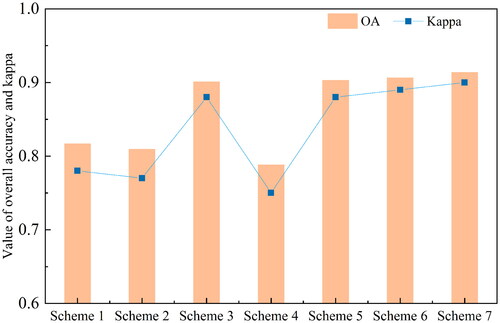
Figure 10. Detailed classification results of seven schemes in area 1.
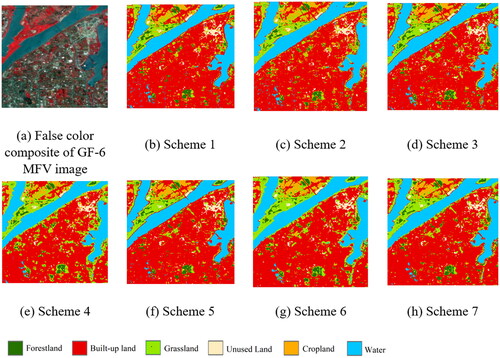
Figure 11. The producer’s accuracy of different categories in 7 schemes.
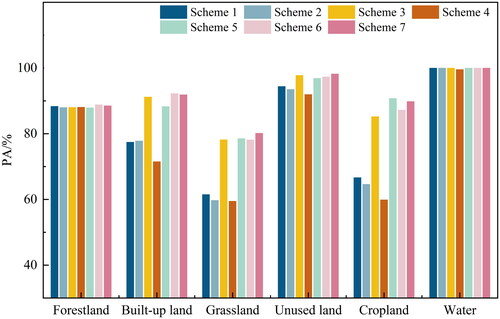
Figure 12. The User’s accuracy of different categories in 7 schemes.
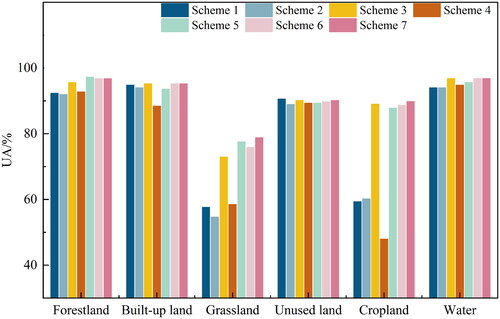
Table 4. Confusion matrix of the classification results using the optimal features.
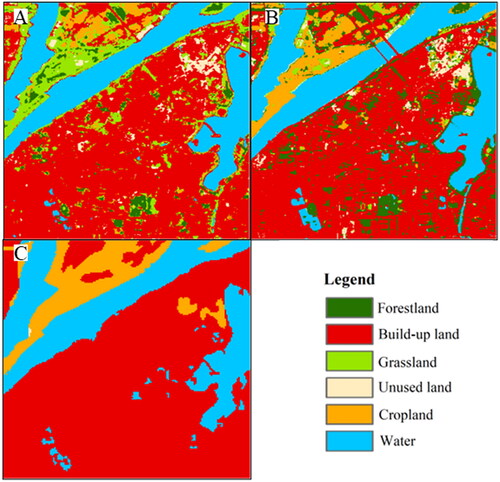
Figure 13. A comparison of LULC classifications among (a) our proposed method, (b) the ESA WorldCover, and (c) GlobeLand30.
Table
Data availability statement
The data that support the findings of this study are available from the corresponding author, WZ, upon reasonable request.