
Figures & data
Figure 1. Study area details showing (a) the Tumbler Ridge District Municipality in British Columbia, Canada, and (b) the 2001 LC of the study area displayed using the Canada Lambert conformal conic projected coordinate system.
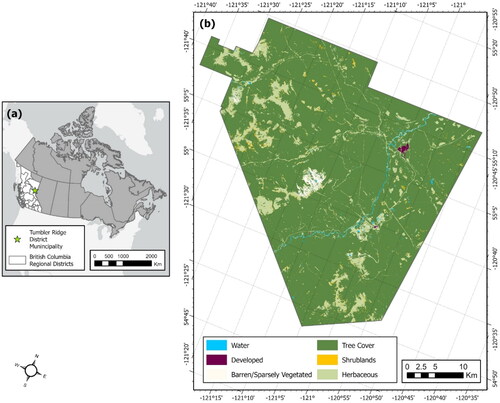
Figure 2. A comparison of the landscape composition in years 2001 and 2019 expressed as a percentage of the landscape.
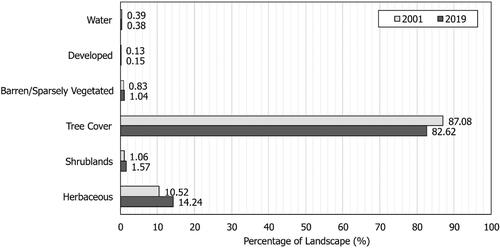
Figure 3. The percentage of annually changed landscape area with respect to each LC class from 2001 to 2019.
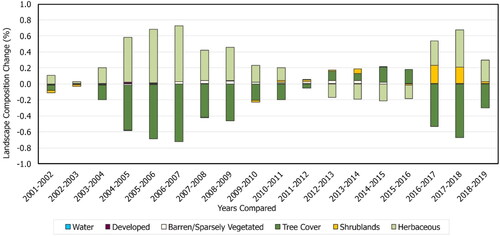
Figure 4. Auxiliary spatial variables prior to Min-max normalization and displayed using the NAD 1983 UTM 10N projected coordinate system: (a) elevation, (b) slope, (c, d) distance to population centres, (e) distance to roads, (f) distance to parks and protected areas, (g) distance to agricultural land reserves, (h) distance to lakes, and (i) distance to rivers.
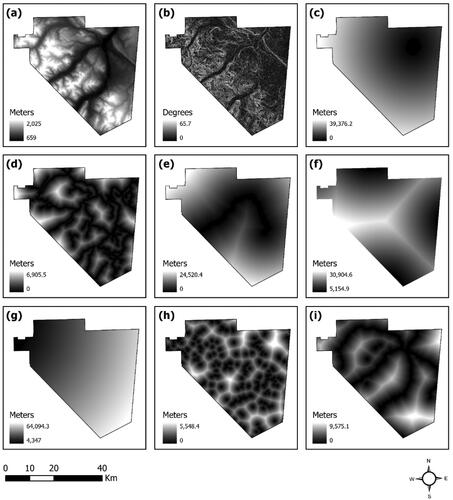
Figure 5. An overview of the hybrid CNN-LSTM model showing the branched structure shared across all model types. Each model branch accepts the spatiotemporal LC data with dimensions and the explanatory spatial variables with dimensions
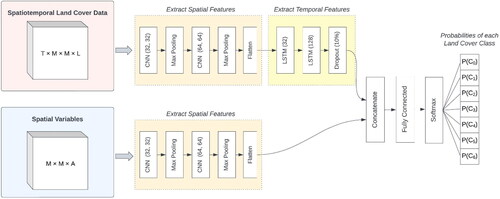
Figure 6. Overview of the LSM-based sample weighting approach implementation.
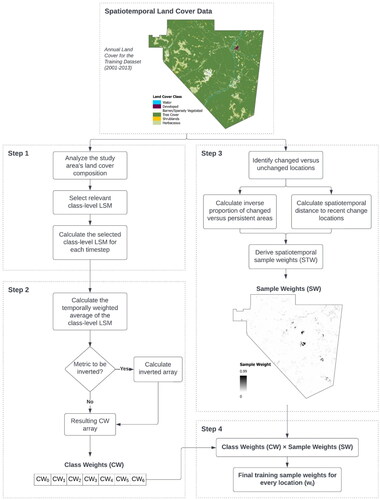
Table 1. The selected class-level LSMs calculated for the 2001 LC of Tumbler Ridge, British Columbia.
Figure 7. Comparison of relative importance assigned to weight each LC class of the study region.
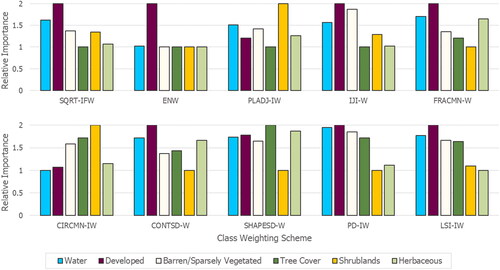
Table 2. Descriptions of the LSM-based class weighting schemes derived from selected measures of aggregation and shape.
Figure 8. Boxplot of FOM measures obtained by comparing the real-world and simulated changes for 2015 across all model types. The three class weighting schemes attributed to the highest average FOM values are shown with the prefix (**).
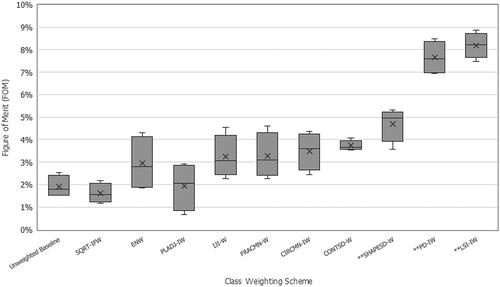
Figure 9. The FOM, PA, and UA calculated with respect to the cumulative LC changes correctly projected from 2015 to 2019.
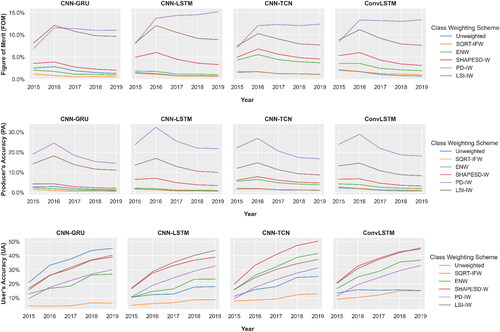
Figure 10. Trends of FOM components attributed to each class weighting scheme for the 2019 land cover forecasts. The box plots depict the percent of study area extent identified as (a) correctly forecasted changes, (b) false alarms, (c) missed changes, and (d) changes forecasted as the incorrect class summarized across all model types.
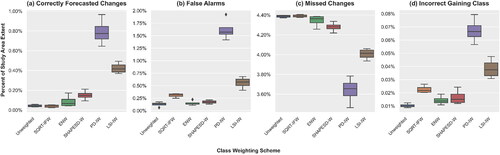
Figure 11. Comparison of cumulative projected and observed changes from 2015 to 2019 for each LC class and the selected class weighting schemes.
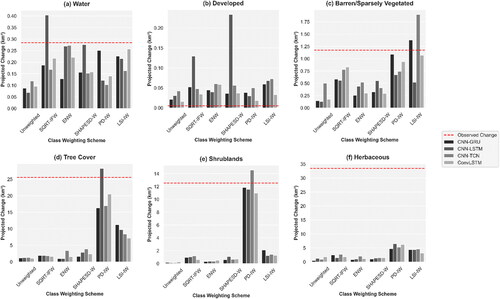
Figure 12. Comparison of the average error in allocation distances computed with respect to the real-world 2019 LC for each class and the selected class weighting schemes.
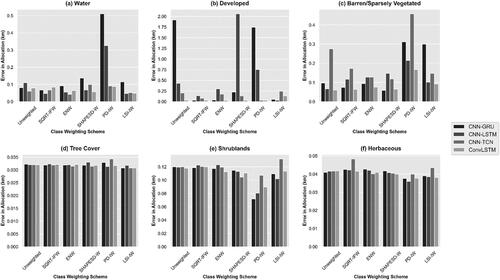
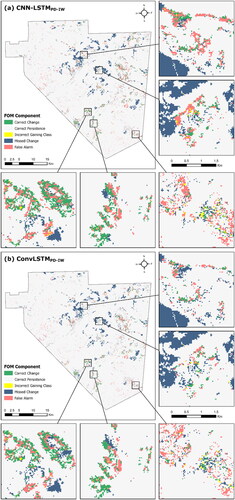
Figure 13. Mapped FOM components of the 2019 LC change forecasts shown for (a) CNN-LSTMPD-IW and (b) ConvLSTMPD-IW displayed using the NAD 1983 UTM 10N projected coordinate system.
Data availability statement
The open datasets used this study include the Global Land Cover Mapping and Estimation (GLanCE) annual 30 m (m) Version 1 data product https://lpdaac.usgs.gov/products/glance30v001/ (accessed 3 January 2023), the Terra Advanced Spaceborne Thermal Emission and Reflection Radiometer (ASTER) Global Digital Elevation Model (GDEM) Version 3 (ASTGTM) https://lpdaac.usgs.gov/products/astgtmv003/ (accessed 2 December 2022), Population Centers and Digital Boundary Files of Canadian Provinces and Territories https://www12.statcan.gc.ca/census-recensement/2011/geo/bound-limit/bound-limit-2016-eng.cfm (accessed 2 December 2022), Canadian Census Road Network https://open.canada.ca/data/en/dataset/57d5ffae-3048-4a19-9b4c-eab12f6322c5 (accessed 2 December 2022), British Columbia Railway Network https://catalogue.data.gov.bc.ca/dataset/railway-track-line (accessed 3 December 2022), Lakes https://catalogue.data.gov.bc.ca/dataset/freshwater-atlas-lakes (accessed 3 December 2022), Rivers https://catalogue.data.gov.bc.ca/dataset/freshwater-atlas-rivers (accessed 2 December 2022), Parks and Protected Areas https://catalogue.data.gov.bc.ca/dataset/parks-and-protected-areas-regional-boundaries (accessed 2 December 2022), Agricultural Land Reserve https://catalogue.data.gov.bc.ca/dataset/alc-alr-polygons (accessed 2 December 2022), and Canadian Cartographic Boundary File https://open.canada.ca/data/en/dataset/a883eb14-0c0e-45c4-b8c4-b54c4a819edb (accessed 28 February 2023).