
Figures & data
Table 1. Main characteristics of analysed land cover products.
Figure 1. Visualizations of analysed land cover products and main data sources used for their production over the city of Trogir in Croatia. Each column represents one land cover product. First in each column is the land cover map with classes coloured according to legends shown at the bottom of each column. CGLS-LC100 land cover map is from 2019 (Buchhorn, Smets, et al. Citation2020), ESA WorldCover is from 2020 (Zanaga et al. Citation2021), ELC10 (Venter and Sydenham Citation2020) from 2018, S2GLC (Malinowski et al. Citation2020) from 2017, ODSE-LULC (only 14 level-2 classes, available at https://stac.ecodatacube.eu/) from 2019, and the Dynamic World (Brown et al. Citation2022) map is from 17 April 2020. All legends are complete, except the one for the CGLS-LC100, for which classes related to forests are aggregated. Between the land cover map and legend, in each column are visualizations of the main data sources that have been used for producing a particular land cover map. Copernicus Sentinel-2 image (R–G–B = B4–B3–B2) was acquired on 17 April 2020, ESA’s PROBA-V image (R–G–B = red band – NIR (near infrared) band – SWIR (shortwave infrared) band, as suggested by Veljanovski, Čotar, and Marsetič (Citation2019)) was acquired on 16 April 2020, USGS’s Landsat 8 image (R–G–B = B4–B3–B2) was acquired on 4 April 2020, and Copernicus Sentinel-1 image (R–G–B = VH band – [(VH + VV)/2 · 1.1 + 30] – VV band (VV – vertical transmit and vertical receive, VH – vertical transmit and horizontal receive), partly adopted from Syrris et al. (Citation2020)) was acquired on 16 April 2020. Light blue pixels on the Sentinel-1 composite correspond to urban areas (Syrris et al. Citation2020). Abbreviations: Copernicus Global Land Services Land Cover map at 100 m (CGLS-LC100), Sentinel-based pan-European land cover Map (ELC10), European Space Agency (ESA), Open Data Science Europe Land use/Land Cover (ODSE-LULC), Project for on-Board Autonomy – Vegetation (PROBA-V), Sentinel-2 Global Land Cover (S2GLC), U.S. Geological Survey (USGS).
![Figure 1. Visualizations of analysed land cover products and main data sources used for their production over the city of Trogir in Croatia. Each column represents one land cover product. First in each column is the land cover map with classes coloured according to legends shown at the bottom of each column. CGLS-LC100 land cover map is from 2019 (Buchhorn, Smets, et al. Citation2020), ESA WorldCover is from 2020 (Zanaga et al. Citation2021), ELC10 (Venter and Sydenham Citation2020) from 2018, S2GLC (Malinowski et al. Citation2020) from 2017, ODSE-LULC (only 14 level-2 classes, available at https://stac.ecodatacube.eu/) from 2019, and the Dynamic World (Brown et al. Citation2022) map is from 17 April 2020. All legends are complete, except the one for the CGLS-LC100, for which classes related to forests are aggregated. Between the land cover map and legend, in each column are visualizations of the main data sources that have been used for producing a particular land cover map. Copernicus Sentinel-2 image (R–G–B = B4–B3–B2) was acquired on 17 April 2020, ESA’s PROBA-V image (R–G–B = red band – NIR (near infrared) band – SWIR (shortwave infrared) band, as suggested by Veljanovski, Čotar, and Marsetič (Citation2019)) was acquired on 16 April 2020, USGS’s Landsat 8 image (R–G–B = B4–B3–B2) was acquired on 4 April 2020, and Copernicus Sentinel-1 image (R–G–B = VH band – [(VH + VV)/2 · 1.1 + 30] – VV band (VV – vertical transmit and vertical receive, VH – vertical transmit and horizontal receive), partly adopted from Syrris et al. (Citation2020)) was acquired on 16 April 2020. Light blue pixels on the Sentinel-1 composite correspond to urban areas (Syrris et al. Citation2020). Abbreviations: Copernicus Global Land Services Land Cover map at 100 m (CGLS-LC100), Sentinel-based pan-European land cover Map (ELC10), European Space Agency (ESA), Open Data Science Europe Land use/Land Cover (ODSE-LULC), Project for on-Board Autonomy – Vegetation (PROBA-V), Sentinel-2 Global Land Cover (S2GLC), U.S. Geological Survey (USGS).](/cms/asset/8501dec3-be9a-4474-96f6-c37b13b45734/tgei_a_2242693_f0001_c.jpg)
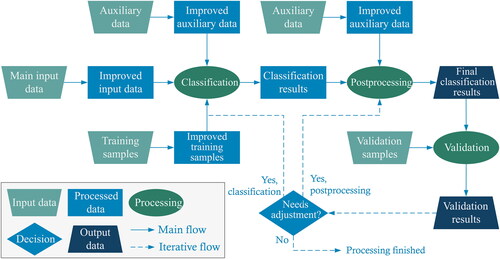
Figure 2. Main steps in producing land cover products. Trapezoids represent input or output data, rectangles correspond to data that are the result of intermediate processing, ovals denote processes, and a diamond-shaped symbol represents a decision.
Data availability statement
Data sharing is not applicable to this article as no new data were created or analysed in this study.