
Figures & data
Figure 1. Technology roadmap.
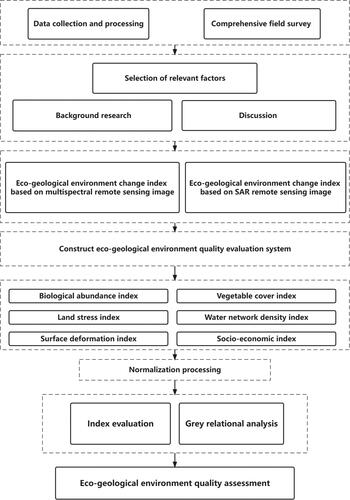
Figure 2. Location map of study area (a) the regional location of Jiangxia District, the red line represents the administrative area of Jiangxia District, and the black line represents the regional area of Wulongquan mining area. (b) Functional zoning of the Wulongquan mine area.
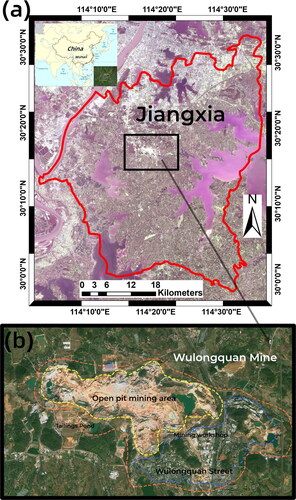
Figure 3. The link and way of land damage in open pit mining (mineral resources, development and utilization of Wulongquan Mine and ecological greening scheme of Wuhan Iron and Steel Corporation, 2019).
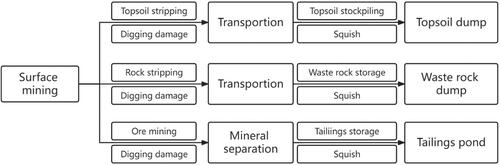
Figure 4. Destruction of land resources and geological disasters in mining areas caused by mining and human activities. (a) Current situation of east open pit of Wulongquan Mine; (b) open-pit mining site; (c) excavation damage in open working area and temporary road; (d) artificial lake and industrial plant in mining area; (e) instability of houses in Wangxian Village; (f) repair marks from the house’s instability (the photos were taken in June 2022).
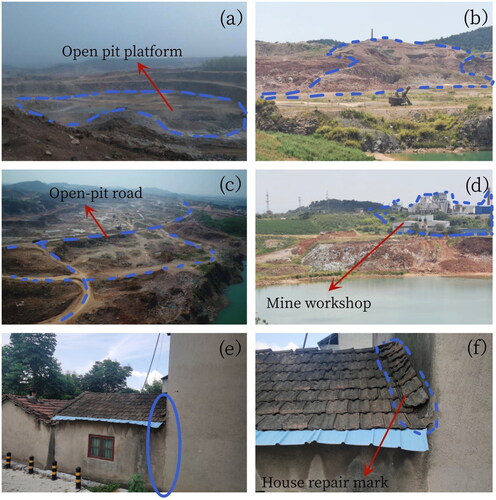
Figure 5. Distribution of vegetation cover in Jiangxia District: (a) the distribution of 2017; (b) the distribution of 2018; (c) the distribution of 2019; (d)the distribution of 2020; (e) the distribution of 2021; (f) distribution of slope of vegetation cover in Jiangxia District from 2017 to 2021; (g) distribution of coefficient of variation of vegetation cover in Jiangxia District from 2017 to 2021; (h) monthly average of vegetation cover in Jiangxia District from 2017 to 2021; (i) year-by-year percentage distribution of vegetation cover degree in Jiangxia District from 2017 to 2021; (j) month-by-month vegetation cover and temperature trends in Jiangxia District from 2017 to 2021.
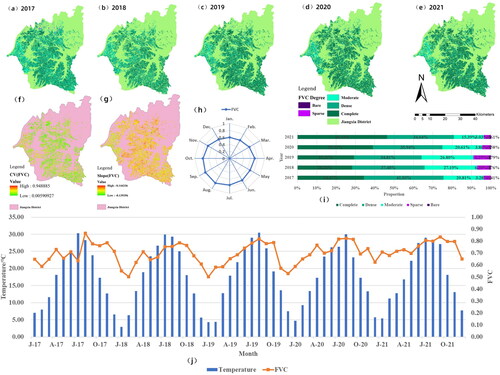
Table 1. Definition of land use/cover change types in the study area.
Figure 6. Land use/cover distribution in Jiangxia District: (a) the distribution of 2017; (a) the distribution of 2018; (a) the distribution of 2019; (a) the distribution of 2020; (a) the distribution of 2021; land use/cover type change over time in Jiangxia District: (f) the change of grass; (g) the change of construction; (h) the change of cultivate land; (i) the change of Forest; (j)the change of garden; (k) the change of bare; (l) the change of water. (m) year-by-year land use/cover area change in Jiangxia District; (n) comprehensive dynamic attitude of land use/cover area change by year in Jiangxia District; (o) year-by-year land use/cover area change single dynamic attitude in Jiangxia District.
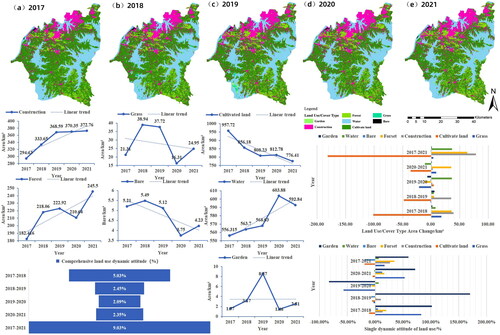
Figure 7. (a) Distribution of accumulated settlement at the Wulongquan mine; deformation in key areas of the Wulongquan mine: (b) the deformation of open pit platform; (c) the deformation of tailings pond; (d) the deformation of Xiamentang Village; (e) the deformation of Wangxian Village; (f) time-series deformation monitoring map of the Wulongquan mine.
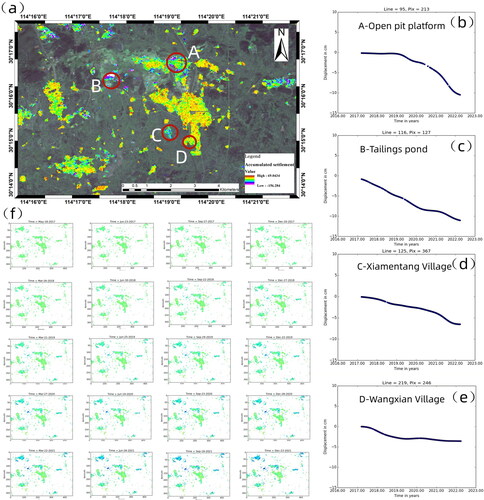
Table 2. Classification of deformation.
Table 3. Social and economic indicators of Jiangxia District.
Table 4. Classification of eco-geological environment quality.
Table 5. Normalization of each index.
Table 6. Grey correlation coefficient.
Table 7. Grey correlation results.
Figure 8. (a) Distribution of calculated weights for each model indicator (LSI, SDI, SEI and BAI); (b) EGQI index weight distribution; (c) results of grey correlation analysis of each index; (d) normalized results of each index; (e) change of EGQI in Jiangxia District from 2017 to 2021.
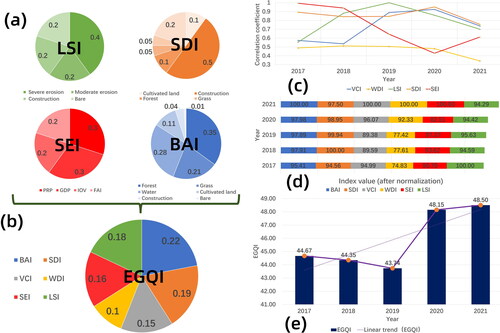
Table 8. Weight calculation.
Data availability statement
The data that support the findings of this study are included in this published article. The datasets generated during and/or analysed during the current study are available from the corresponding author on reasonable request.