Figures & data
Figure 1. The study area: (a) Central Plains Urban Agglomeration and (b) Shandong Peninsula Urban Agglomeration.
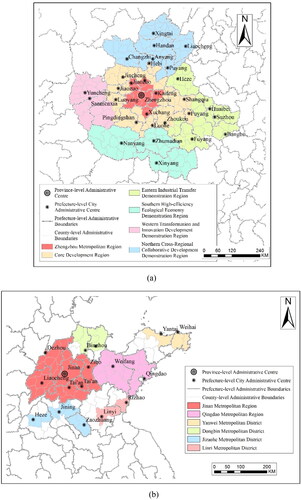
Figure 2. Overall process of the proposed method.
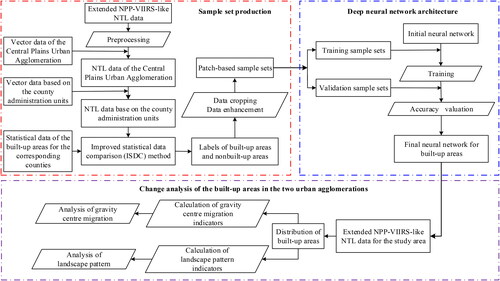
Figure 3. The deep neural network architecture applied in this study.
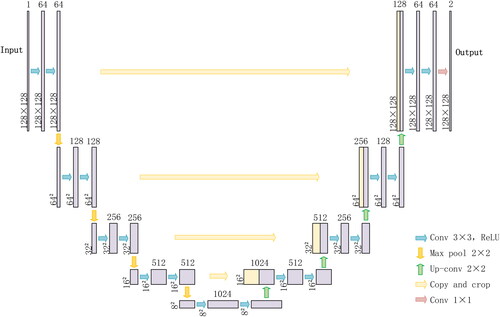
Table 1. Descriptions of landscape pattern indicators.
Table 2. The confusion matrix.
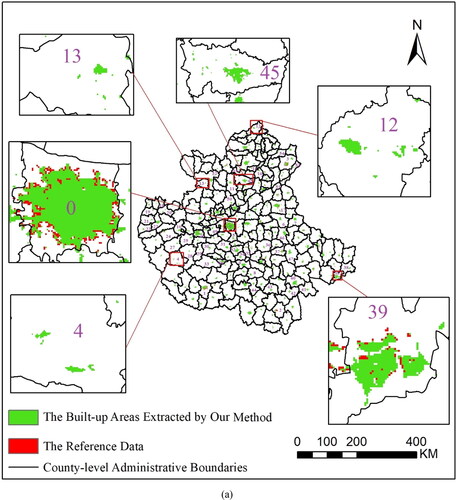

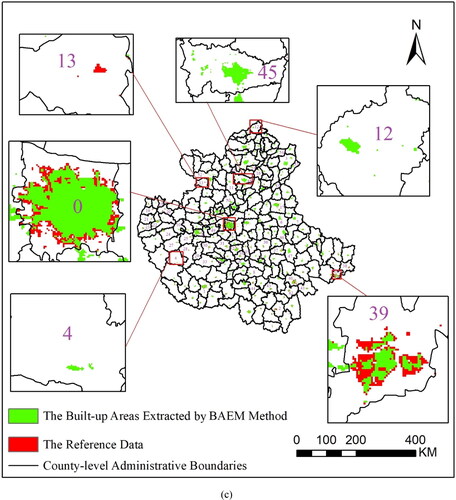
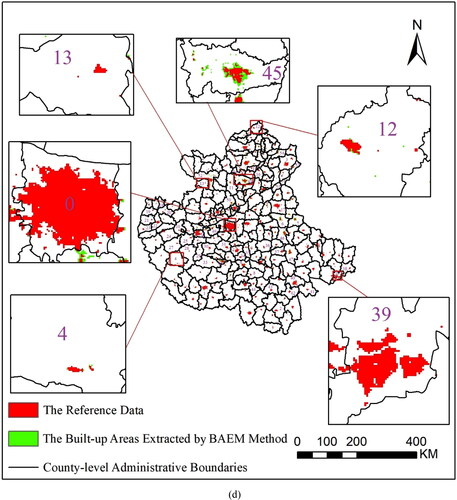
Table 3. Comparison of different methods.
Figure 5. Changes in the built-up areas in the study area from 2000 to 2020: (a) Central Plains Urban Agglomeration and (b) Shandong Peninsula Urban Agglomeration.
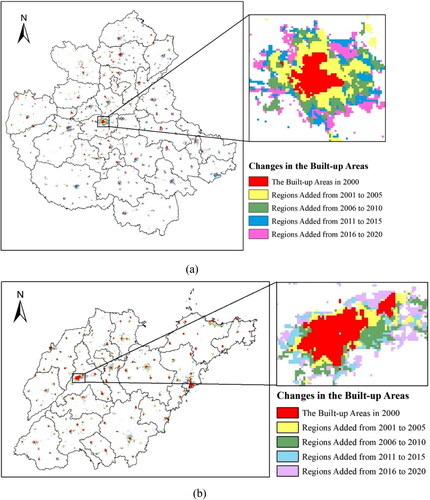
Table 4. The statistics of the gravity centre migration of the built-up areas in the Central Plains Urban Agglomeration.
Table 5. The statistics of the gravity centre migration of the built-up areas in the Shandong Peninsula Urban Agglomeration.
Figure 6. The gravity centre migration trajectories of the built-up areas in the study area from 2000 to 2020: (a) Central Plains Urban Agglomeration and (b) Shandong Peninsula Urban Agglomeration.
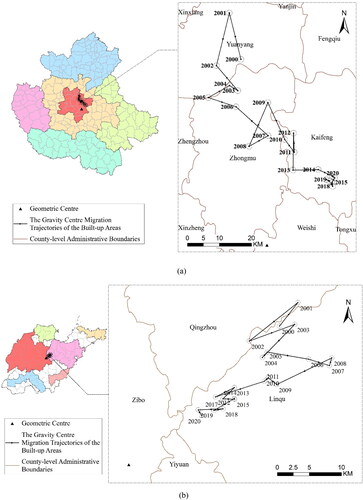
Table 6. The calculation results of the landscape pattern indicators of the built-up areas in the Central Plains Urban Agglomeration.
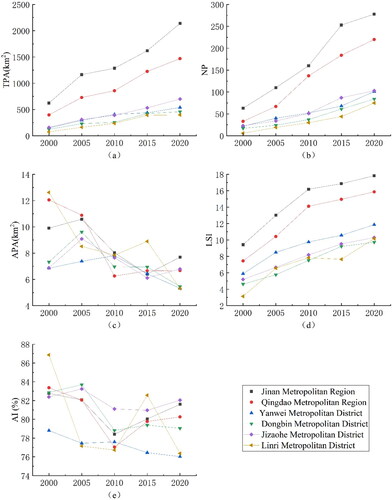
Figure 7. The changes in the typical landscape pattern indicators in the six main regions of the Central Plains Urban Agglomeration: (a) TPA, (b) NP, (c) APA, (d) LSI, and (e) AI.
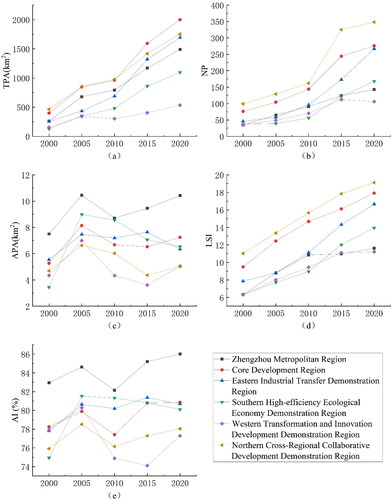
Table 7. The calculation results of the landscape pattern indicators of the built-up areas in the Shandong Peninsula Urban Agglomeration.
Figure 8. The changes in the landscape pattern indicators of the six areas in the Shandong Peninsula Urban Agglomeration from 2000 to 2020: (a) TPA, (b) NP, (c) APA, (d) LSI, and (e) AI.