
Figures & data
Figure 1. Geological map (UTM coordinates, zone 48 N) of the study area (Hieu et al. Citation2015). the faults reported by Phach and Anh (Citation2018) are shown by the red lines.
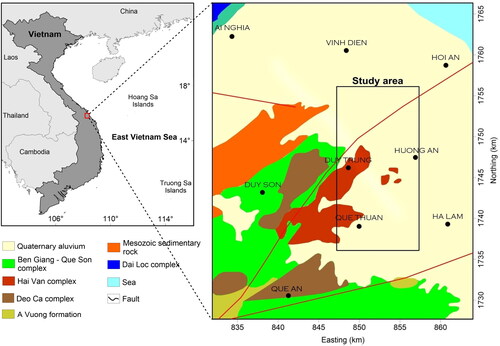
Figure 2. (a) Aeromagnetic anomaly map of the study area, (b) reduced-to-equator (RTE) aeromagnetic anomaly map of the study area.
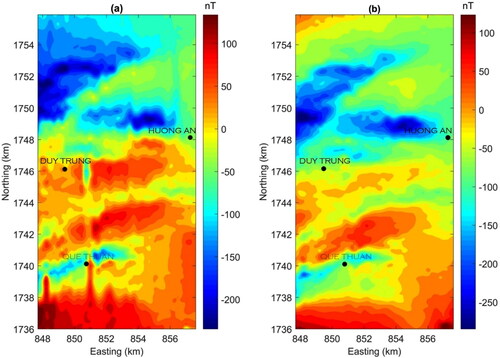
Figure 3. (a) Synthetic model, (b) magnetic anomaly of the model, (c). Gaussian random noise. Dashed lines show the true edges.
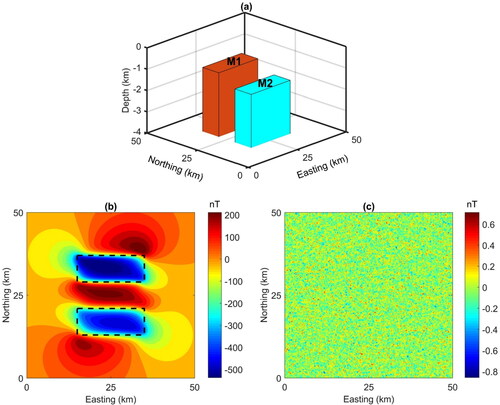
Figure 4. Enhanced maps of the noise-free synthetic data (): (a) TAHG, (b) ITM, (c) HGSTDR, (d) FSED, (e) EHGA, (f) BHG. Dashed lines show the true edges.
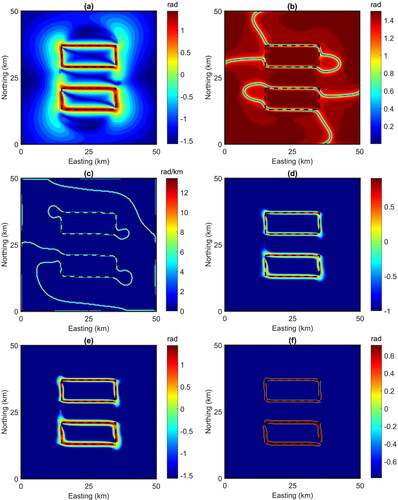
Table 1. Parameters of the synthetic model.
Figure 5. Enhanced maps of the noise-free synthetic data (): (a) TAHG, (b) ITM, (c) HGSTDR, (d) FSED, (e) EHGA, (f) BHG. Dashed lines show the true edges.
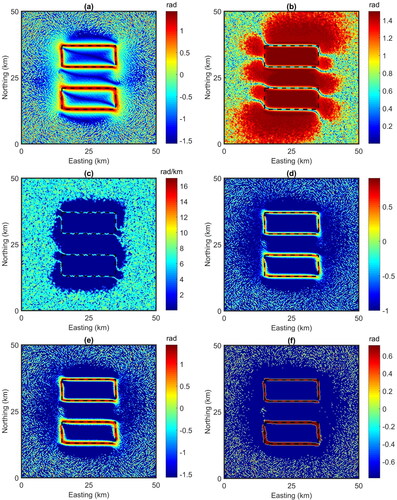
Figure 6. Enhanced maps of the RTE aeromagnetic data (): (a) TAHG, (b) ITM, (c) HGSTDR, (d) FSED, (e) EHGA, (f) BHG.
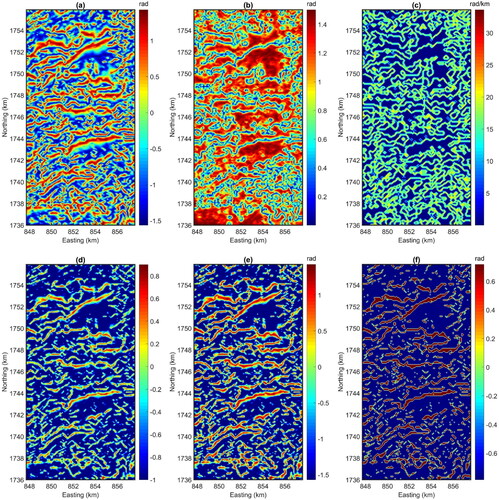
Figure 7. Upward continuation maps of the RTE aeromagnetic data (): (a) 100 m, (b) 500 m.
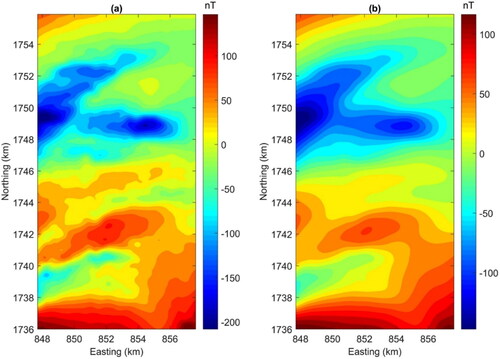
Figure 8. Enhanced maps of the 100 m upward continued aeromagnetic data (): (a) TAHG, (b) ITM, (c) HGSTDR, (d) FSED, (e) EHGA, (f) BHG.
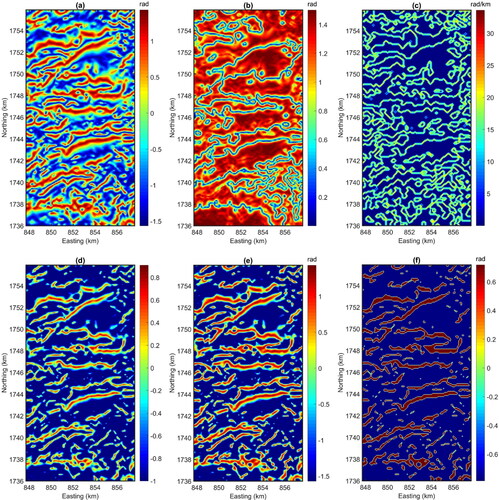
Figure 9. Enhanced maps of the 500 m upward continued aeromagnetic data (): (a) TAHG, (b) ITM, (c) HGSTDR, (d) FSED, (e) EHGA, (f) BHG.
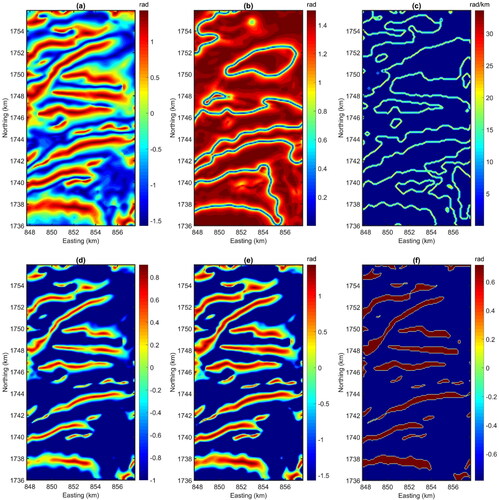
Figure 10. (a) the depths to the magnetic sources obtained by the SPI method, (b) the depths to the magnetic sources obtained by the an-EUL method, (c) Histogram of the SPI depths, (d) Histogram of the an-EUL depths.
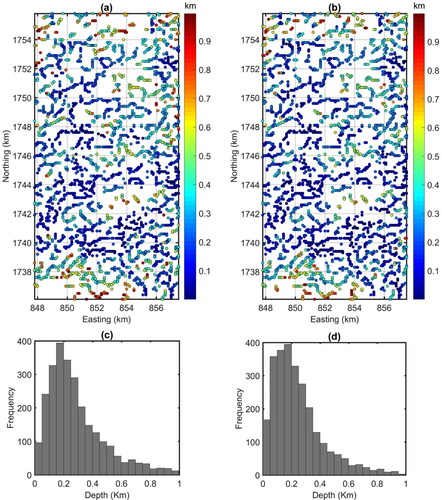
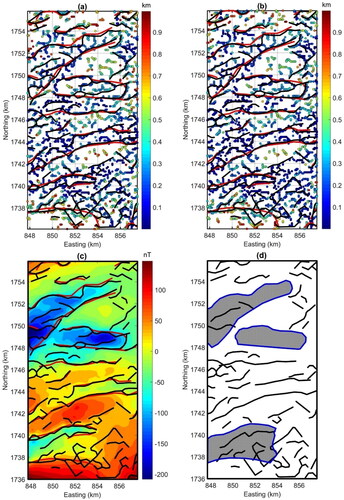
Figure 11. Magnetic lineaments from upward-continued data with height 100 m (black lines) and 500 m (red lines), superimposed on the SPI solutions (a), an-EUL solutions (b) and 100 m upward-continued RTE data (c), structural map of the study area, inferred from aeromagnetic data interpretation (d). probable granitic intrusions are also marked as grey areas.
Data availability statement
The data that support the findings of this study are available from the corresponding author, upon reasonable request.