
Figures & data
Figure 1. Location map of the upper Awash basin and its watersheds.
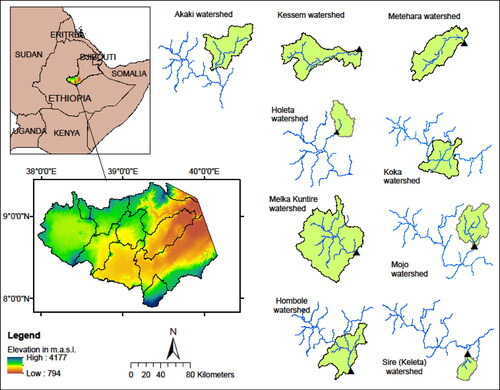
Table 1. Input data type and sources for blue and green water flow (GWF) estimation using the InVEST model and agricultural water scarcity indices.
Figure 2. Methodological framework for computation of green-blue water resources in the upper Awash basin.
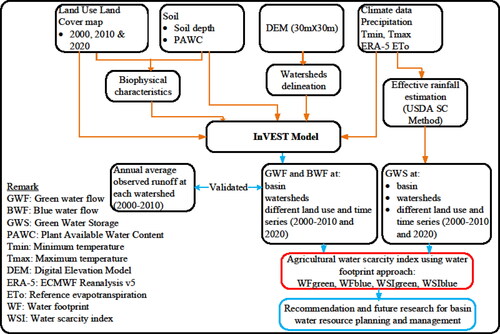
Table 2. Biophysical table of the upper Awash basin.
Figure 3. Spatial distribution of the input data for estimating the green and blue water flows of the upper Awash basin for the year 2000.
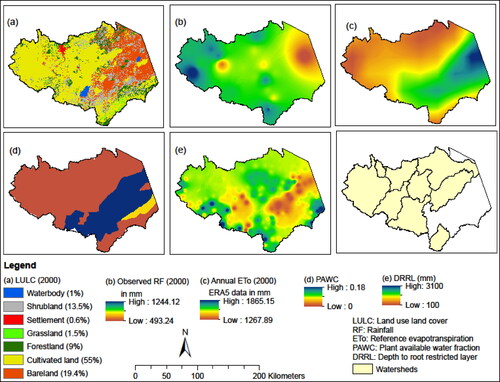
Figure 4. Spatial distribution of the input data for estimating the green and blue water flows of the upper Awash basin for the year 2010.
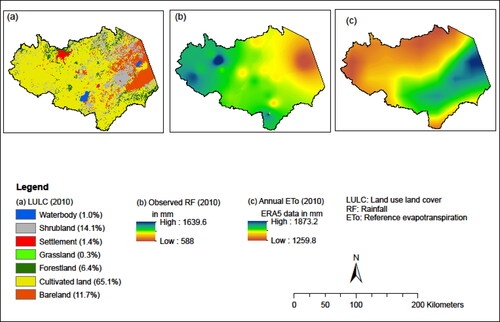
Figure 5. Spatial distribution of the input data for estimating the green and blue water flows of the upper Awash basin for the year 2020.
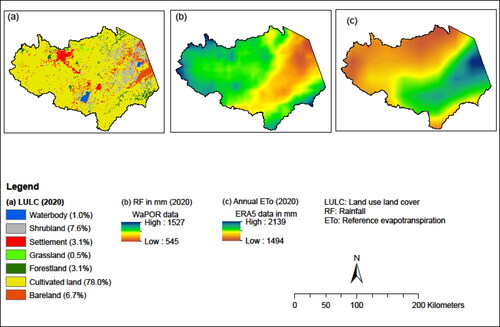
Table 3. Model validation criteria (Moriasi et al. Citation2007).
Table 4. Water scarcity index ranges (Hoekstra et al. Citation2012; Xie et al. Citation2020).
Figure 6. Validation of the blue water flow at different watersheds in the upper Awash basin.
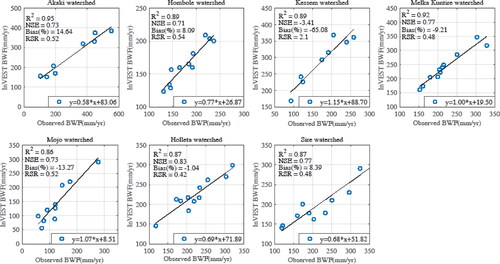
Table 5. Land use land cover areal coverage and percent share in the upper Awash basin (Hirpa et al. Citation2023).
Table 6. Decadal hydro-climatic conditions and green and blue water flow in upper Awash basin.
Figure 7. Box plot showing the median, quantile, and range of (a) annual rainfall; (b) annual potential evapotranspiration (PET); (c) annual green water flow (GWF); and (d) blue water flow (BWF) distributions of the upper Awash basin. Aka: Akaki; Hom: Hombole; Kes: Kessem; Kok: Koka; met: Metehara; Moj: Mojo; NHo: Holleta; Sir: Sire.
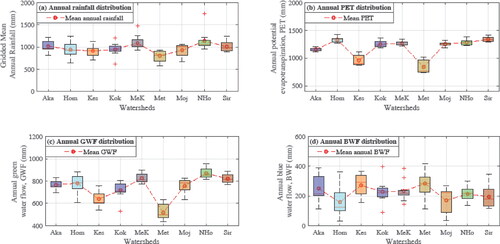
Table 7. Interannual variability of hydroclimatic variables in the upper Awash basin between 2000 and 2010.
Figure 8. Spatial and temporal variation of available water resources in the upper Awash basin: (a to f) the decadal green and blue water flow; (g-i) 12–years average blue and green water flows and green water storage across the basin, respectively.
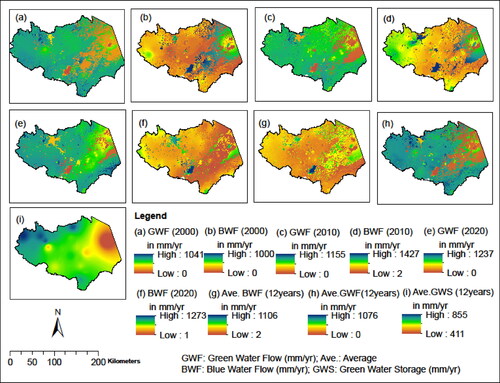
Table 8. Interannual variability of blue and green water flow in the upper Awash basin between 2000 and 2010.
Figure 9. The decadal green water flow (GWF) and green water storage (GWS) in different watersheds (a and b) and in different LULC (c and d) of the upper Awash basin. Ho: Holleta watershed; Sir: Sire watershed; MeK: Melka-Kuntire watershed; Hom: Hombole watershed; Moj: Mojo watershed; Aka: Akaki watershed; Kok: Koka watershed; Kes: Kessem watershed; Met: Metehara watershed. FL: Forestland; CL: Cultivated land; GL: Grassland; SL: Shrubland; Set: Settlement; BL: Bare land; WB: Waterbody.
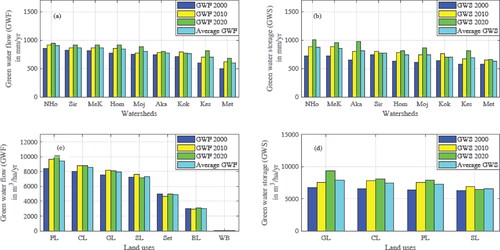
Table 9. Green water flow for different land uses in the upper Awash basin.
Figure 10. The decadal blue water flows (BWF) in (a) different watersheds of the upper Awash basin; and (b to d) LULC. MeK: Melka Kuntire sub-basin, Aka: Akaki watershed; Ho: Holleta watershed; Kok: Koka watershed; Sir: Sire watershed; Met: Metehara watershed; Kes: Kessem watershed; Hom: Hombole watershed; Moj: Mojo watershed. FL: Forestland; CL: Cultivated land; GL: Grassland; SL: Shrubland; Set: Settlement; BL: Bare land; WB: Waterbody.
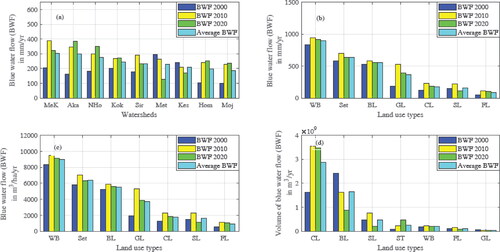
Table 10. BWF Proportions in different land uses and years in the upper Awash basin.
Table 11. Green water scarcity index of the rainfed crops in upper Awash basin.
Table 12. Blue water scarcity index of the irrigated sugarcane in upper Awash basin.