
Figures & data
Figure 1. Location of the Letaba watershed, South Africa.
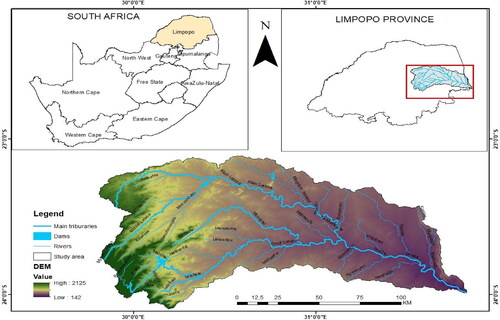
Figure 2. the Schematic flow chart showing steps.
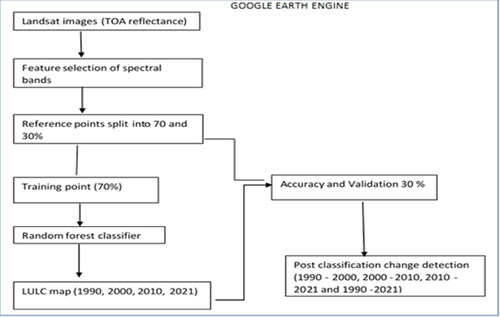
Table 1. Land use and land cover classification description.
Figure 3. Variables of importance percentage derived using the RF variable selection method.
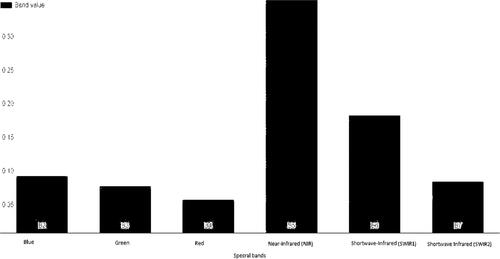
Table 2. Derived LULC error matrix for the year 1990, 2000, 2010 and 2021.
Figure 4. Spatiotemporal pattern of LULC at Letaba watershed.
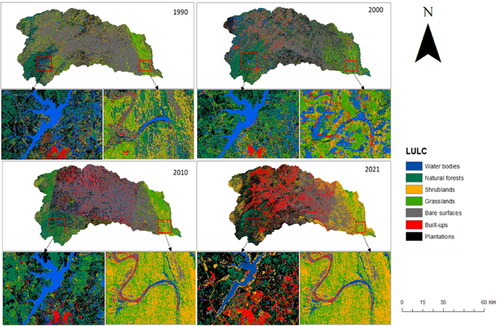
Table 3. Area covered by each class type for four-time period.
Figure 5. Representation of total area LULC change (gains and loss) on Letaba watershed for the time period 1990, 2000, 2010 and 2021.
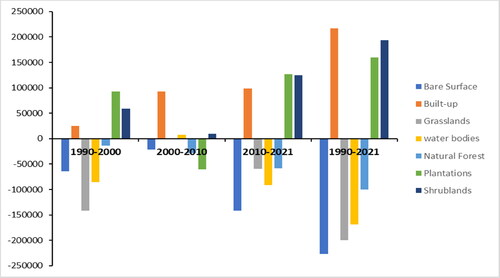
Table 4. the rate of change in LULC classes from the year 1990 to 2021.