
Figures & data
Figure 1. Study area map.
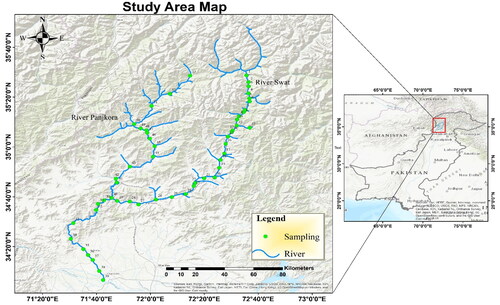
Table 1. Sampling location points names and coordinates.
Figure 2. Distribution of physiochemical characteristics of rivers. (a) Potential of hydrogen, (b) Electroconductivity, (c) Total dissolved solids, and (d) Temperature.
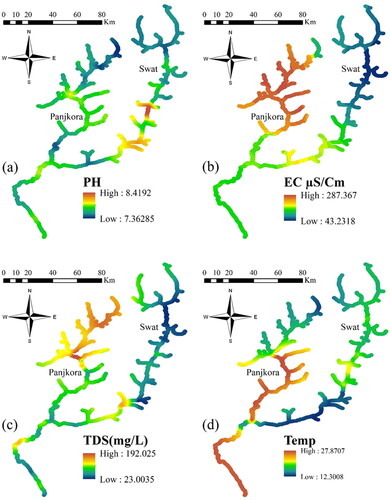
Figure 3. Heavy metal distribution. (a) Cd, (b) Cr, (c) Pb, (d) Ni, (e) Fe, and (f) As.
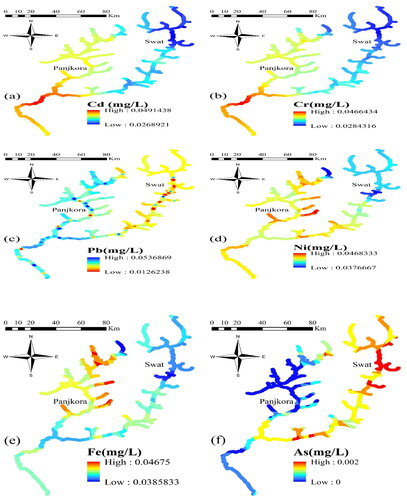
Table 2. Pearson correlation values in River Swat and River Panjkora, Pakistan.
Table 3. Principal component analysis results of surface water (n = 53) collected from Swat and Dir, Pakistan.
Table 4. Comparison of heavy metals concentrations (μg/L) in river water in River Swat and River Panjkora with other rivers in the world.
Figure 4. (a) Loading factor. (b) First initial factors F1, and F2.
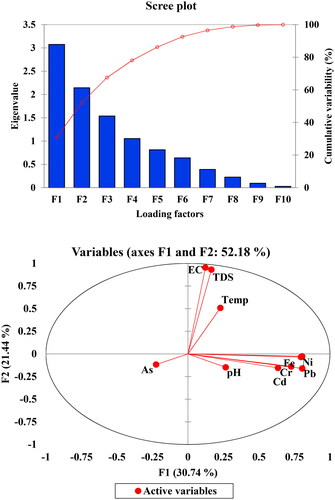
Figure 5. Dendrogram showing clustering of sampling stations River Swat and River Panjkora water quality features.
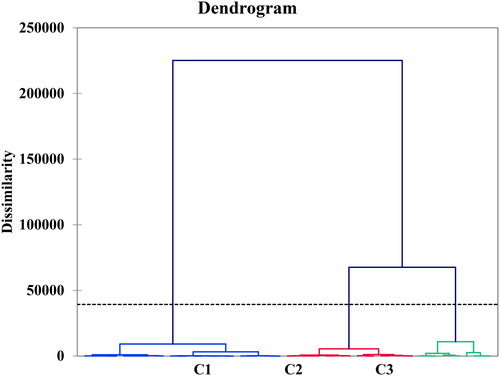
Table 5. Descriptive statistics of trace elements collected from River Swat and River Panjkora water District Swat, Pakistan.