
Figures & data
Figure 1. Location map of the study area.
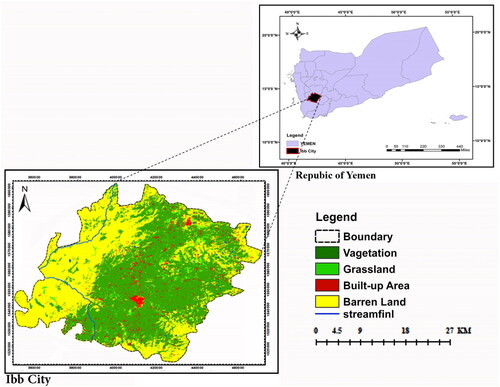
Table 1. Detail of data sources used for analysis of LULC in the study.
Figure 2. The flow chart of the LULC change mapping methodology.
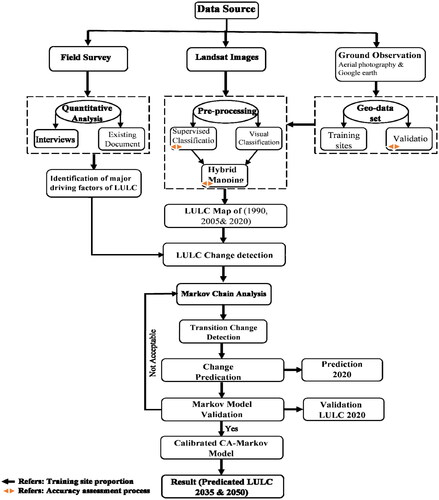
Table 2. Description of LULC classification types.
Table 3. Accuracy assessment of LULC classified for 1990, 2005, and 2020.
Figure 3. The five broad groups of proximal drivers and underlying causes of LULC change.
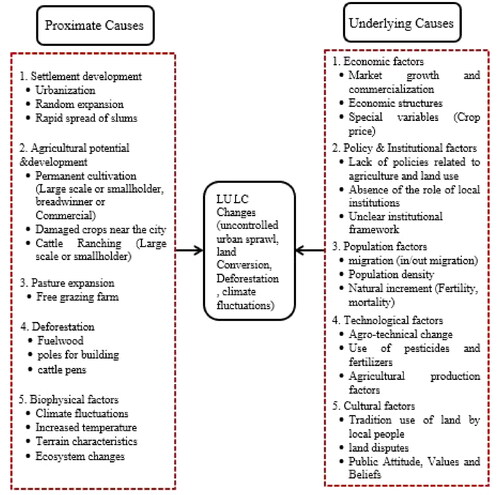
Figure 4. LULC maps of Ibb city in 1990, 2005, and 2020.
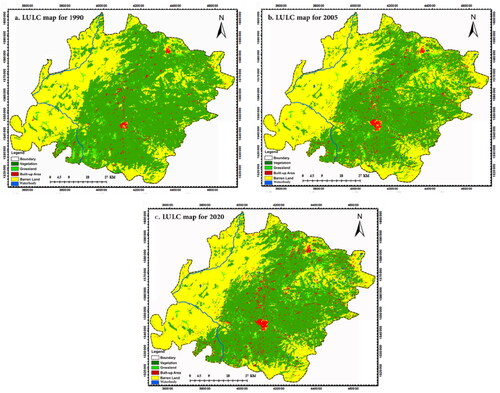
Table 4. The area statistics of LULC, percent, and annual change rate between 1990, 2005, and 2020.
Table 5. Markov probability matrix derived for LULC change from 1990 to 2005 and 2005 to 2020.
Figure 5. Dynamics of LULC change in Ibb city in the years 1990, 2005, and 2020.
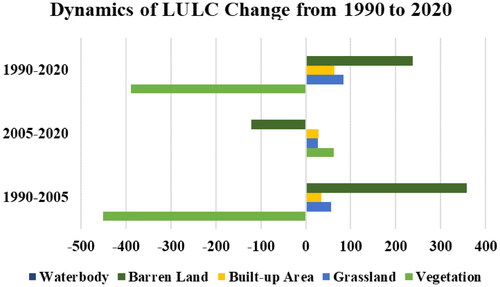
Figure 6. Gains, losses, and net change area of LULC class between 1990 and 2020.
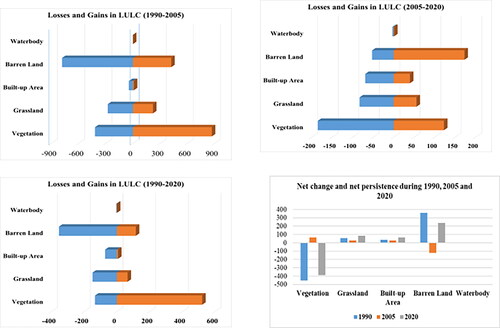
Figure 7. Total annual trends of rainfall and average annual maximum and minimum temperature.
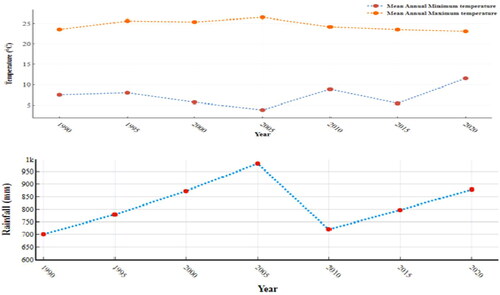
Table 6. Population of Ibb city (source: CSO).
Table 7. Validation of LULC change predictions.
Table 8. The k-indicator values of LULC predicted map of 2020.
Figure 8. Predicted distribution of the modeled LULC of 2035 and 2050.
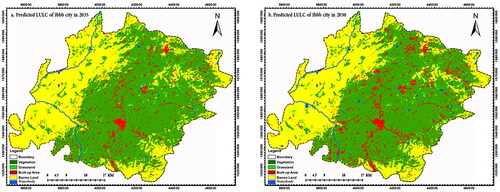
Table 9. Statistical distribution of LULC simulations under different modeled 2035 and 2050.
Figure 9. Gain, loss, and net change of the projected LULC area (2020, 2035, and 2050).
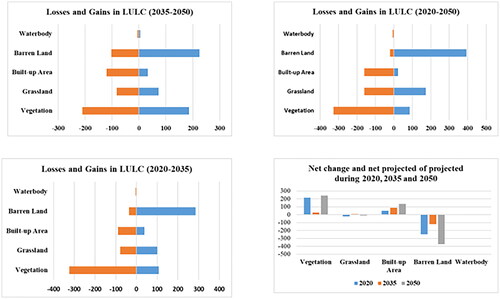
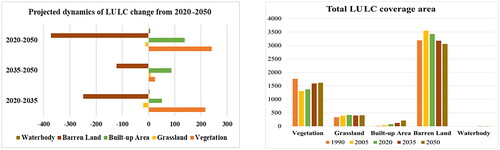
Figure 10. Historical and predicted LU/LC change area coverage.
Data availability statement
The data presented in this study are available from the corresponding author (B.Q.D.) upon request.