Figures & data
Figure 1. Geographical location and administrative division of the study area.
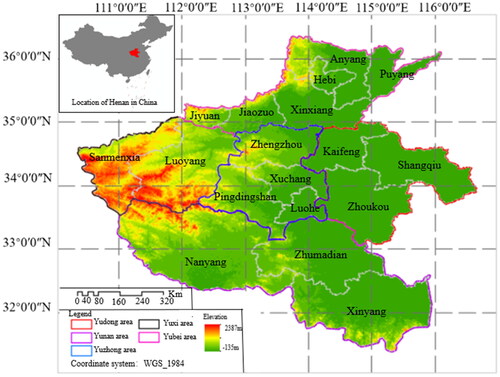
Figure 2. Land use/land cover changes in Henan Province in 1990, 2000, 2010, and 2020.
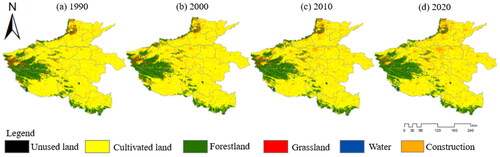
Table 1. Land-use change impact factors and description.
Figure 3. Percentage of land use types by subspace in Henan Province, 1990–2020.
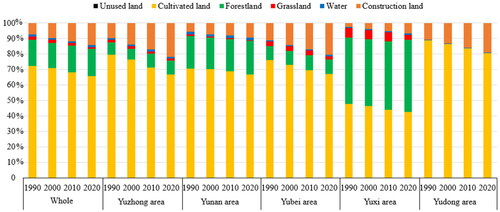
Figure 4. Dynamic attitude of land use in Henan Province and its subspaces from 1990 to 2020.
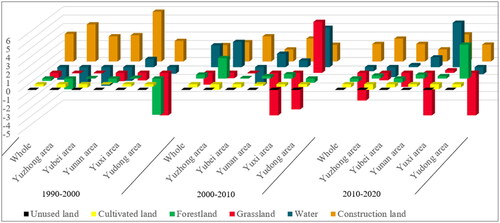
Figure 5. Sankey map of land-use types in Henan Province and subspaces from 1990 to 2000.
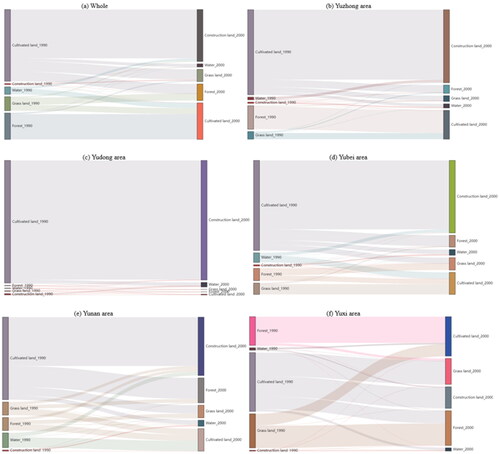
Figure 6. Sankey map of land use types in Henan Province and subspaces from 2000 to 2010.
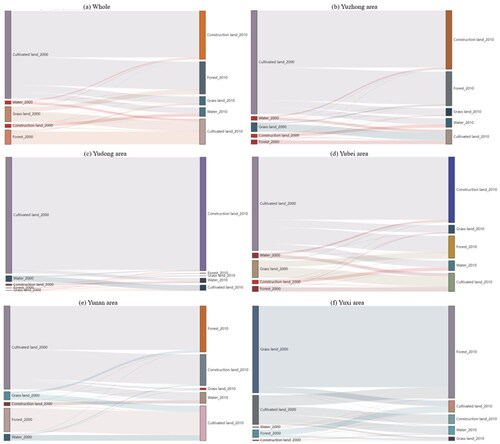
Figure 7. Sankey map of land use types in Henan Province and subspaces from 2010 to 2020.
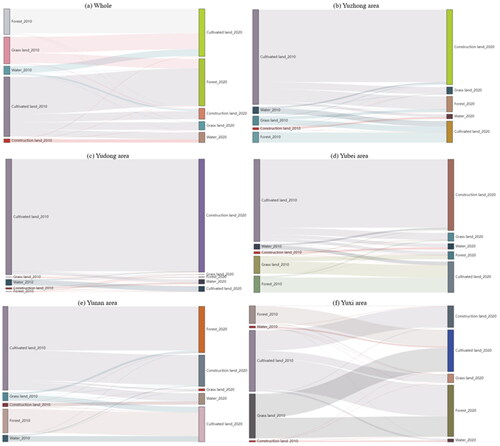
Figure 8. Mapping of the rise in Henan Province, 1990–2020.
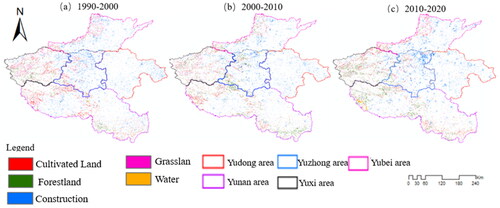
Figure 9. Mapping of the fall in Henan Province, 1990–2020.
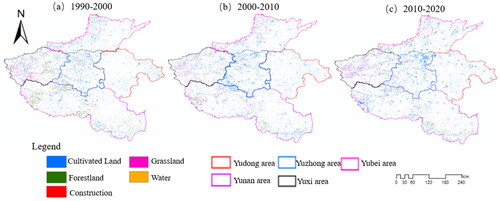
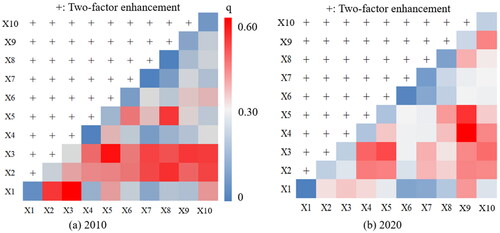
Figure 10. Mapping of factor detection results in Henan Province in 2010 and 2020.
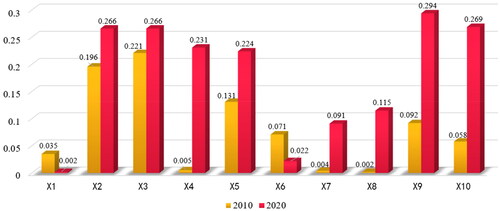
Figure 11. 2010 Henan Province and each subspace cultivated land factor detection q-value.
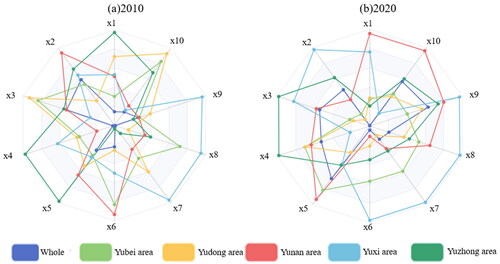
Figure 12. Interaction detection results of cultivated land area factors in Henan Province.