Figures & data
Table 1. Sources of groundwater contamination in the study area (Brook and Dawoud Citation2005).
Figure 1. The main divisions and regions of the United Arab Emirates(a) and the Emirate of Abu Dhabi.
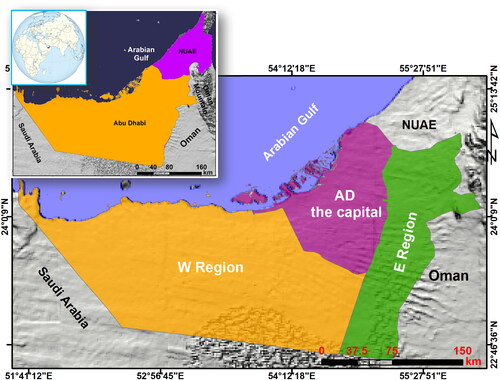
Figure 2. Maps of the spatial distribution of precipitation (a), sources of groundwater contamination (b), graphs of monthly temperature and precipitation (c), and population growth (d) over the Emirate of Abu Dhabi.
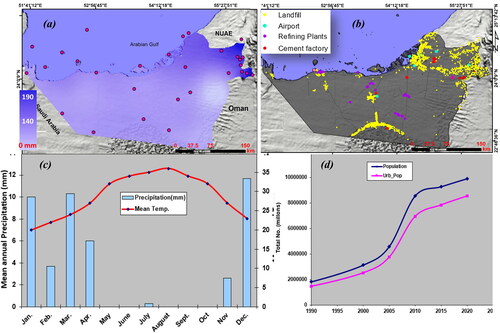
Table 2. Data layers and data type used in groundwater potential index.
Table 3. Confusion matrix of the year 2000 and 2020 classification map.
Figure 3. Spatiotemporal variation of built-up area (a), vegetation area (b) during 2000-2020, and types of buildings (c), and vegetations (d).
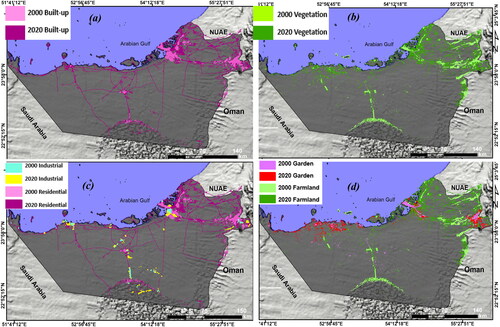
Figure 4. The graphical representation of the total area in km2 of built-up and vegetated area changes from 2000 to 2020.
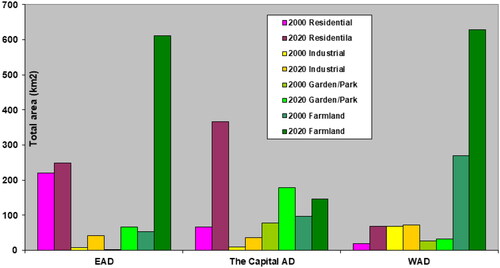
Table 4. LULC change detection analysis in Dubai for the years 2000–2020.
Figure 5. Regional spatial distribution of the groundwater level depletion (in m) (up), and nitrate concentration (mg/L) (down) in the Emirate of Abu Dhabi from 2000 to 2020.
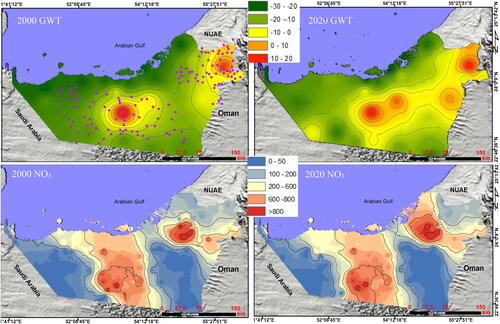
Figure 6. Regional spatial distribution of groundwater salinity (mg/L) (up), and TDS concentration (mg/L) (down) in the Emirate of Abu Dhabi from 2000 to 2020.
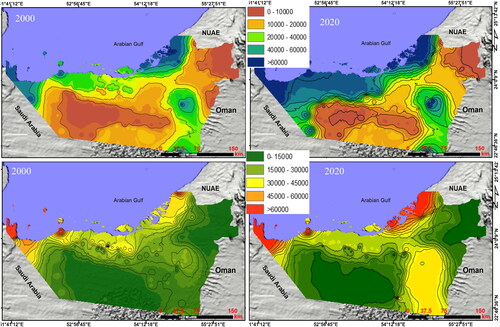
Figure 7. Regional spatial distribution of electric conductivity of the groundwater (up), and IWQI (down) in the Emirate of Abu Dhabi from 2000 to 2020.
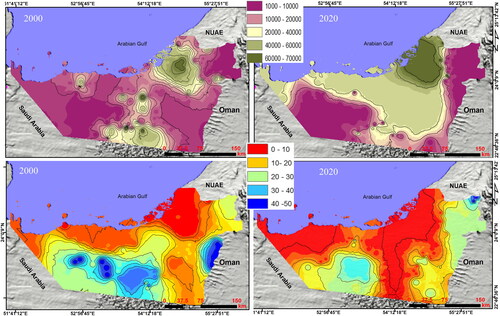
Figure 8. Relationship between groundwater table and vegetation density(a), LULC density against nitrate concentration (b), groundwater salinity (c), TDS (d), SAR (e) and IWQI (f).
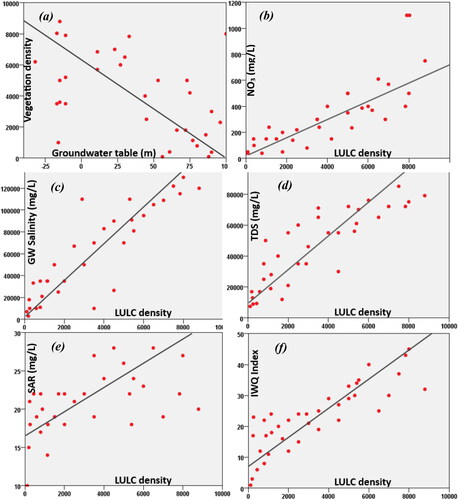
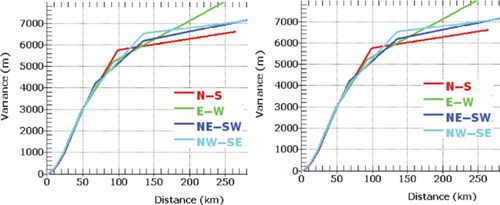
Figure 9. Semivariogram models for four directions of the 2020 maps of LULC (a) and TDS (b). These are generated from 2020 raster maps of LULC and TDS.