
Figures & data
Table 1. BEMs and top performance models that have been used in GWPM.
Figure 1. Study area.
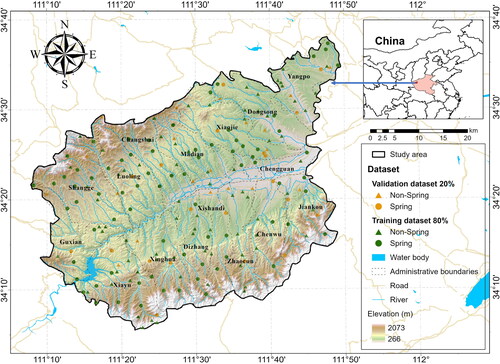
Figure 2. Methodology framework.
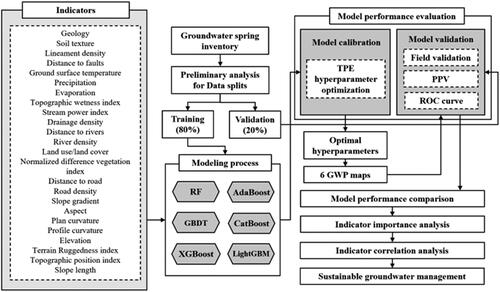
Table 2. Data sources and indicators.
Figure 3. Geological parameters. (a) GEO; (b) LD; (c) DTF; (d) ST.
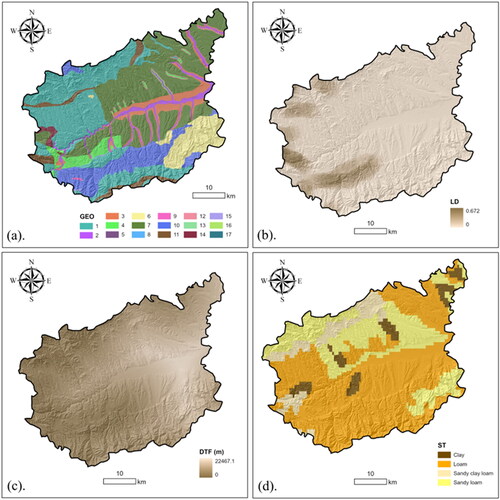
Figure 4. Climate parameters. (a) GST; (b) PRE; (c) EVA.
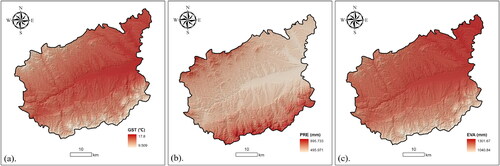
Figure 5. Hydrological parameters. (a) TWI; (b) SPI; (c) DD; (d) RID; (e) DTRI.
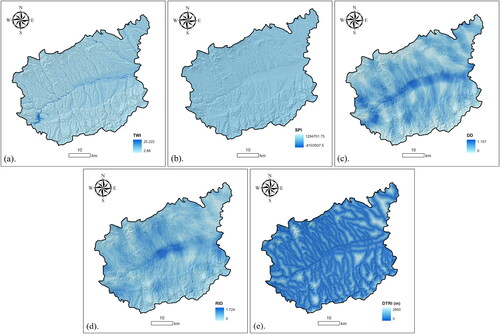
Figure 6. Topographic parameters. (a) ELE; (b) SG; (c) ASP; (d) PLC; (e) PRC; (f) TRI; (g) TPI; (h) SL.
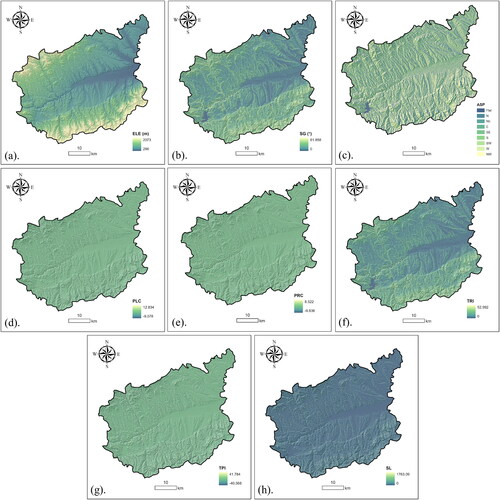
Figure 7. Land use and human activity parameters. (a) LULC; (b) NDVI; (c) DTRO; (d) ROD.
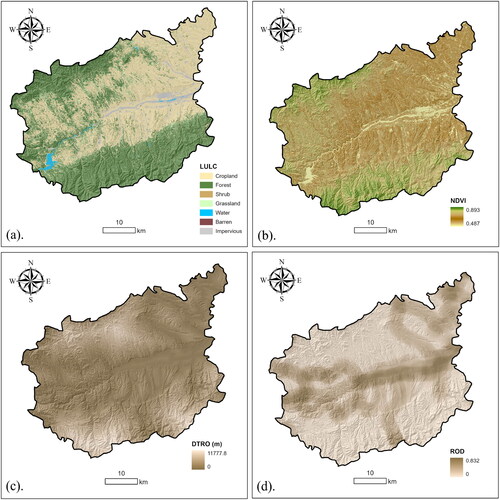
Figure 8. GWP maps. (a) RF; (b) AdaBoost; (c) GBDT; (d) CatBoost; (e) XGBoost; (f) LightGBM.
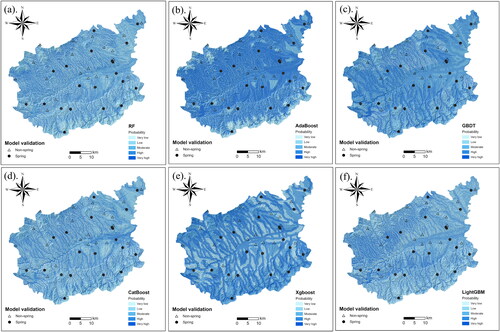
Table 3. Hyperparameter optimization results of different models.
Table 4. Areas of GWP levels in different models.
Table 5. Field validation results.
Figure 9. Model validation results. (a) RF; (b) AdaBoost; (c) GBDT; (d) CatBoost; (e) XGBoost; (f) LightGBM.
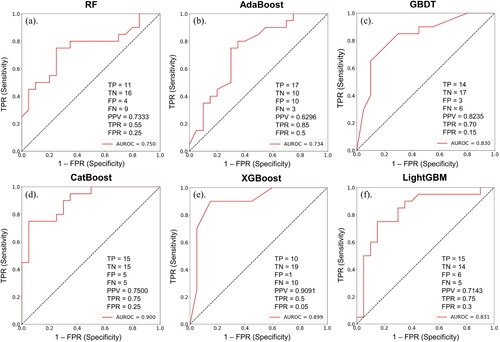
Figure 10. Importance analysis of indicators. (a) RF; (b) AdaBoost; (c) GBDT; (d) CatBoost; (e) XGBoost; (f) LightGBM.
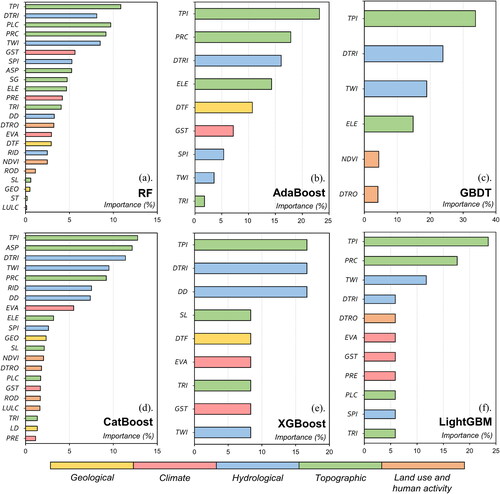
Figure 11. Correlation analysis of important indicators. (a) Random points; (b) Pearson correlation coefficient result; (c) Spearman correlation coefficient result; (d) Kendall correlation coefficient result.
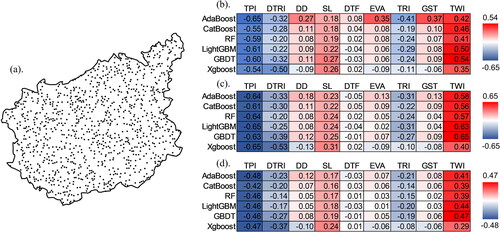
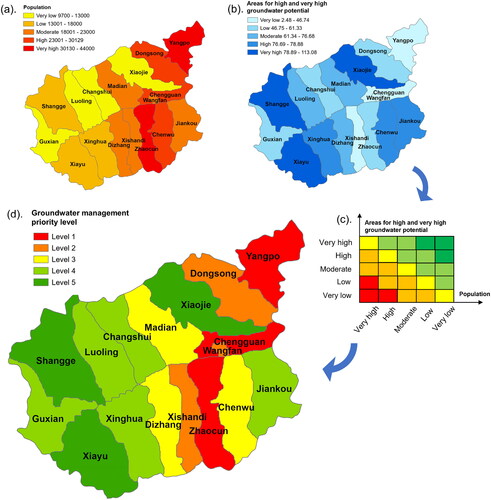
Figure 12. The determination of groundwater management priority levels. (a) Population distribution; (b) Areas for high and very high GWP; (c) The matrix for the combination of population and GWP map; (d) Groundwater management priority levels in Luoning County.
Supplemental Material
Download MS Word (688.2 KB)Data availability
The authors do not have permission to share data.