Figures & data
Figure 1. Scope of the study.
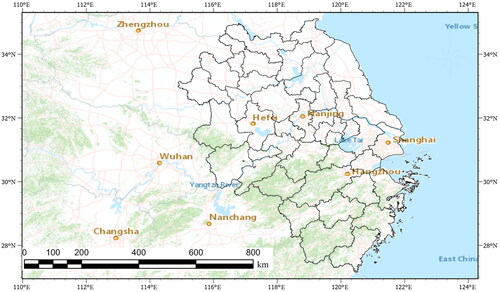
Table 1. Descriptive statistics of the factors influencing the spatial differentiation of urban polycentricity.
Figure 2. The comparison of the spatial distribution of the population in the primary center between 2006 and 2020.
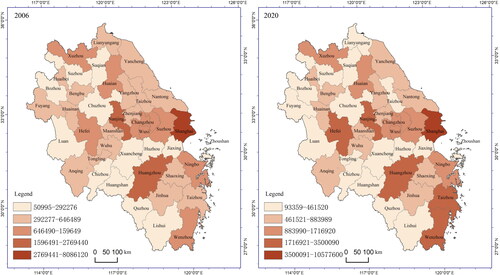
Figure 3. The comparison of the spatial distribution of the population in the secondary centers between 2006 and 2020.
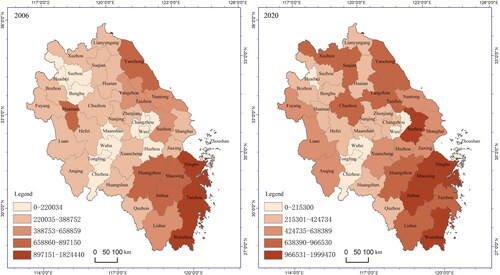
Figure 4. Spatial distribution of urban polycentric index from 2006 to 2020.
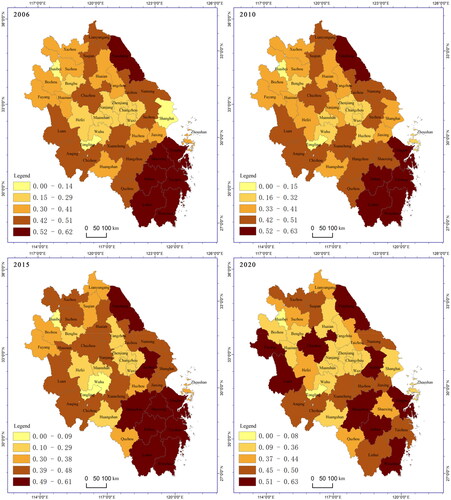
Figure 5. Spatial clustering distribution of the urban polycentric index from 2006 to 2020.
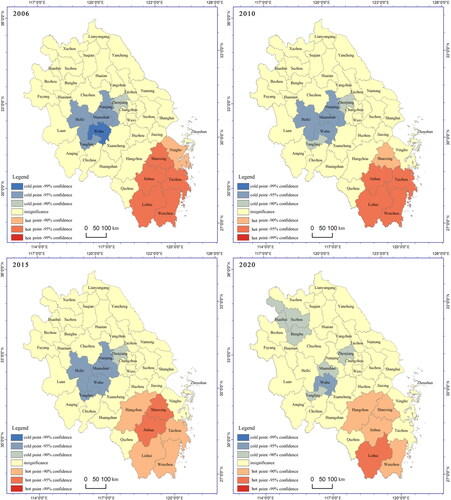
Table 2. Factor detection results for the polycentric spatial differentiation.
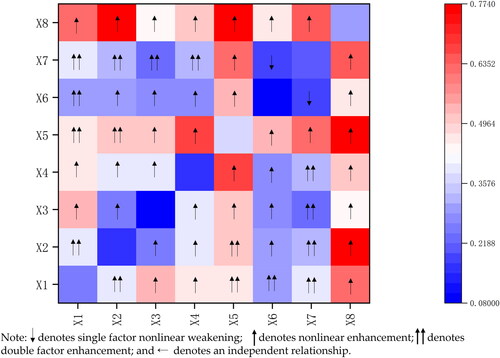
Figure 6. Factor interaction detection results of polycentric spatial differentiation in 2010.
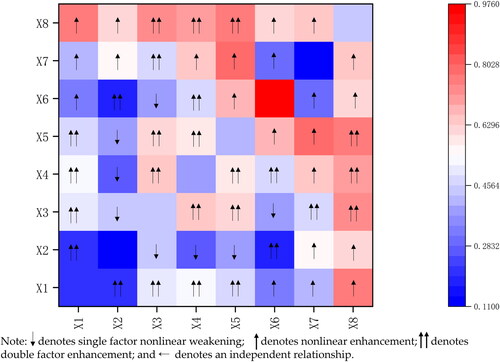
Figure 7. Factor interaction detection results of polycentric spatial differentiation in 2020.