
Figures & data
Figure 1. The location of Ethiopia from Africa and the meteorological stations used in this study.
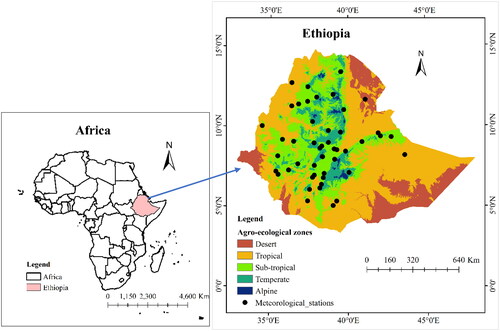
Figure 2. The long-term annual average rainfall (1991–2020) values of the observed data, and CHIRPS v2.0 and MSWEP v2.8 estimates over the different AEZs of the country.
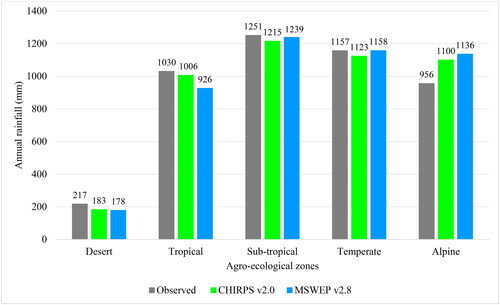
Table 1. Descriptions of CHIRPS v2.0 and MSWEP v2.8 rainfall products.
Figure 3. Schematic diagram showing the methodological flows of this study.
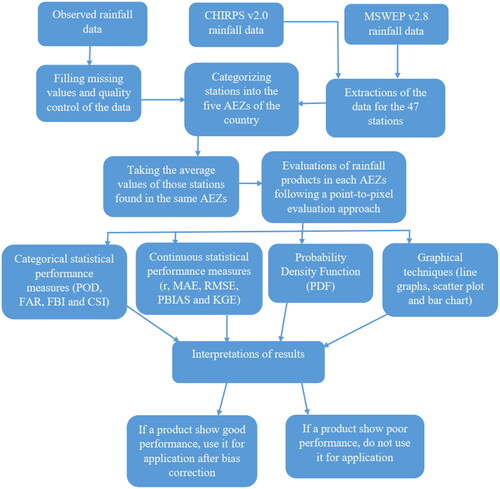
Table 2. The list of the considered performance measure statistics used in this study and its best values.
Table 3. The contingency table presenting the agreement between observed records (Po) and satellite/reanalysis rainfall (Ps) for different rainfall intensity ranges (the threshold is ≥1 mm).
Table 4. Performances of CHIRPS v2.0 and MSWEP v2.8 annual rainfall estimates at different AEZs of Ethiopia during 1991–2020.
Figure 4. The bar graph representation of the observed annual rainfall with MSWEP v2.8 and CHIRPS v2.0 over desert, tropical, sub-tropical, temperate, and alpine AEZs of Ethiopia from 1991 to 2020.
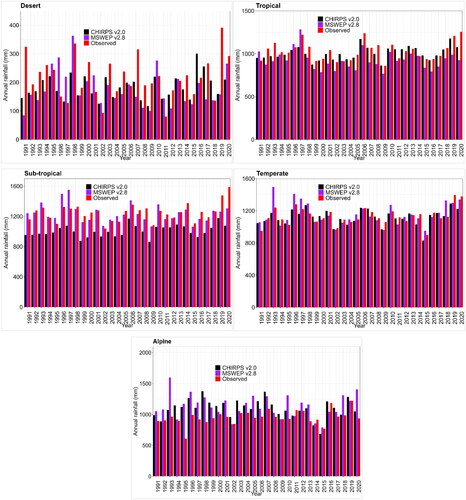
Table 5. Statistical continuous metrics analysis comparing seasonal (Belg and Kiremt) CHIRPS v2.0 and MSWEP v2.8 rainfall estimations with ground gauged data of AEZs in Ethiopia from 1991 and 2020.
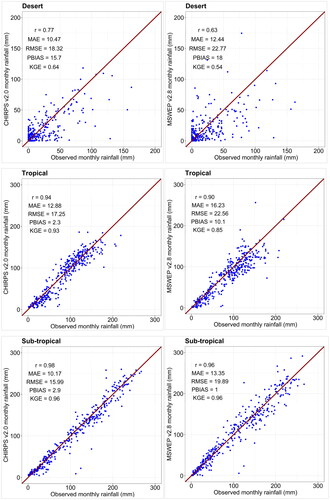
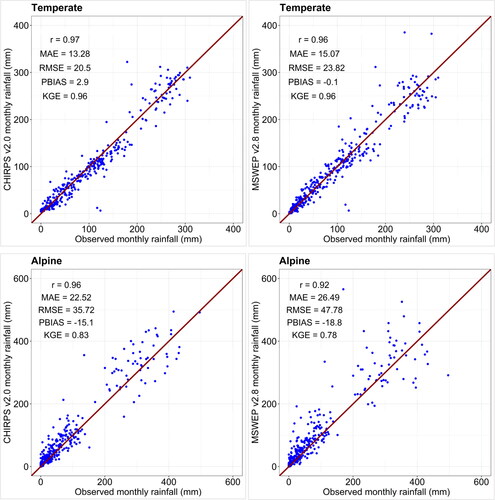
Figure 6. Line graph of mean monthly observed rainfall with MSWEP v2.8 and CHIRPS v2.0 rainfall over desert, tropical, sub-tropical, temperate, and alpine AEZs of Ethiopia for the time period 1991–2020.
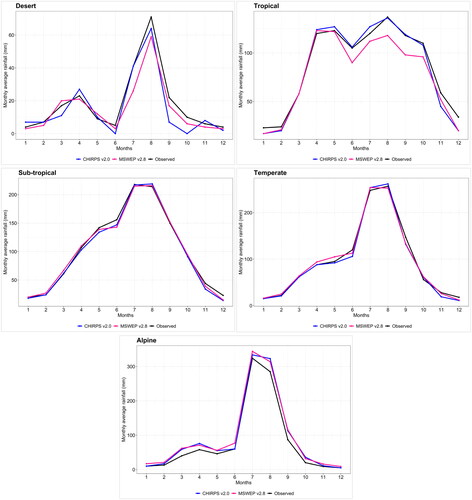
Table 6. Comparing daily rainfall estimates of CHIRPS v2.0 and MSWEP v2.8 with observed rainfall data over the five AEZs of Ethiopia during1991–2020 periods.
Table 7. Detection skill scores of daily rainfall (threshold ≥ 1 mm) estimates of CHIRPS v2.0 and MSWEP v2.8 satellite/reanalysis rainfall estimates for Ethiopian AEZs during 1991–2020.
Figure 7. The PDF daily rainfall events of CHIRPS v2.0 and MSWEP v2.8 products against observed data at different intensity levels over desert, tropical, sub-tropical, temperate, and alpine AEZs of Ethiopia during 1991–2020 periods.
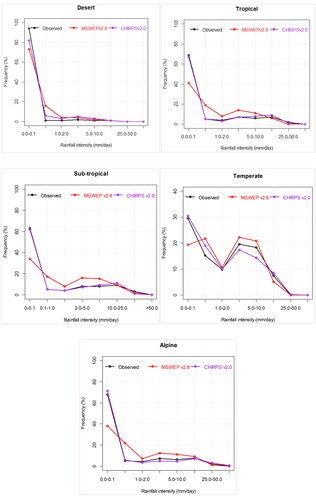
Table 8. Summary of overall performance of CHIRPS v2.0 and MSWEP v2.8 for simulating rainfall from daily to annual temporal scales over the five AEZs of Ethiopia in the majority/entire performance measure statistics.