
Figures & data
Figure 1. Zhongshan city, Guangdong province, China.
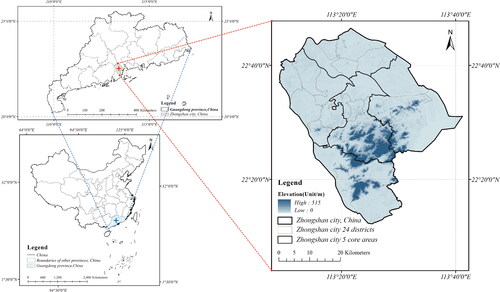
Table 1. Remote sensing image data on Zhongshan city in 2000, 2011, and 2022.
Table 2. LUCC number and classification.
Table 3. Grading standard of the comprehensive index of the degree of land use.
Figure 2. Structure of cellular automata (CA).
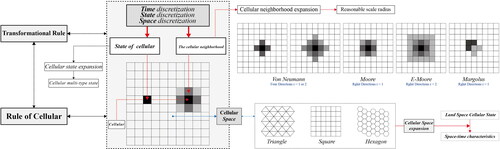
Figure 3. Natural and climate drivers.
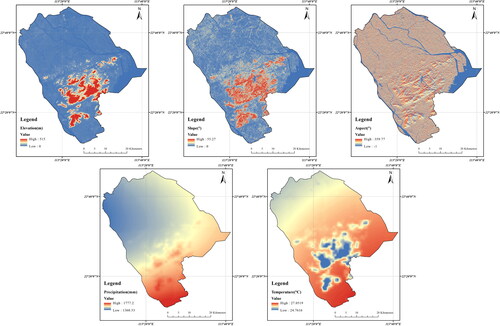
Figure 4. Socioeconomic drivers.
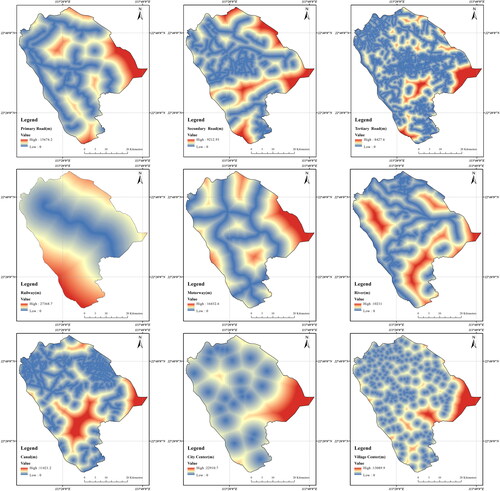
Figure 5. Reachability drivers.
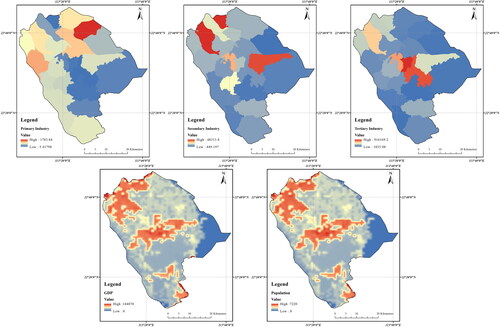
Table 4. Factors driving the evolution of land use types.
Table 5. Threat factor parameter settings.
Table 6. Suitability and sensitivity of various land use types.
Table 7. Habitat quality levels in Zhongshan city.
Figure 6. Spatial distribution of land use types in Zhongshan city in 2000, 2011 and 2022.
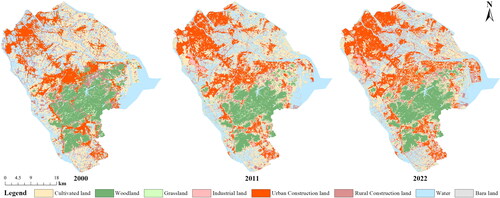
Figure 7. Spatial structure of land use in Zhongshan city from 2000 to 2022.
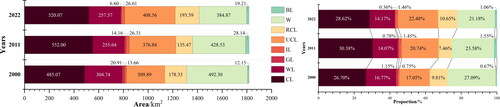
Figure 8. Transfer matrix of land use types in Zhongshan city from 2000 to 2022.
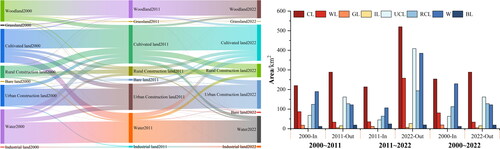
Figure 9. Single dynamic attitude and comprehensive dynamic attitude of land use in Zhongshan city from 2000 to 2022.
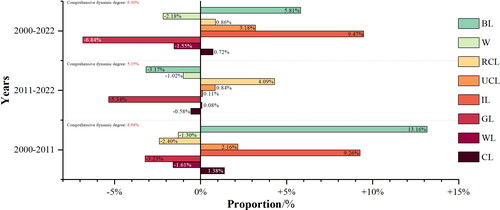
Table 8. Spatial analysis model of land use in Zhongshan city from 2000 to 2022.
Figure 10. Spatial distribution of habitat quality at different grades in Zhongshan city from 2000 to 2022.
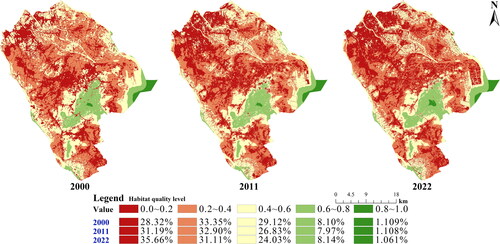
Figure 11. The area quantity and proportion of different grades of habitat quality in Zhongshan city from 2000 to 2022.
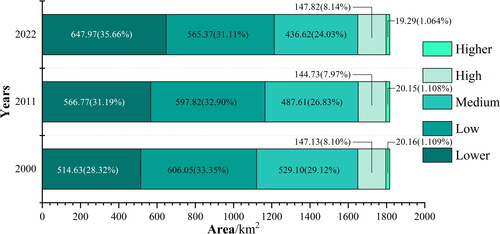
Table 9. Habitat quality index of Zhongshan city from 2000 to 2022.
Figure 12. Distribution and structural changes in the land spatial pattern in Zhongshan city in 2035 based on four scenarios.
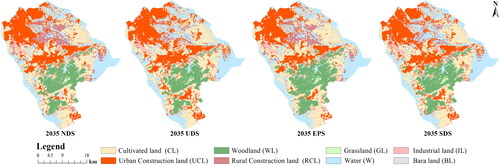
Figure 13. Changes in the number and proportion of land use types in Zhongshan city in 2035 under the four scenarios.
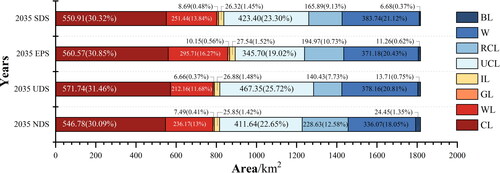
Figure 14. The transition matrix of land use types in Zhongshan city in 2035 under the four scenarios.
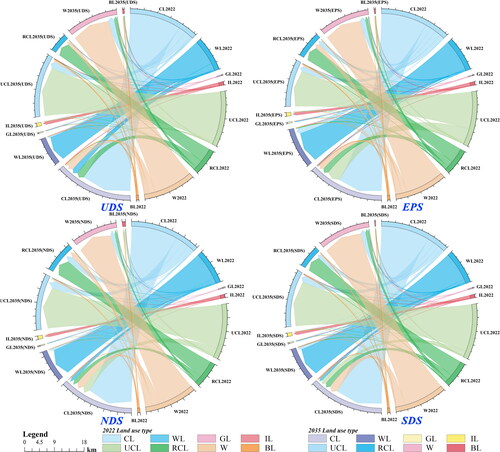
Figure 15. Spatial pattern distribution of habitat quality under the four scenarios in 2035.
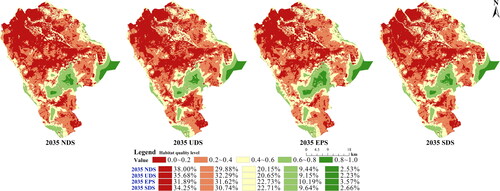
Figure 16. Changes in the area quantity and proportion of habitat quality at different levels under the four scenarios in 2035.
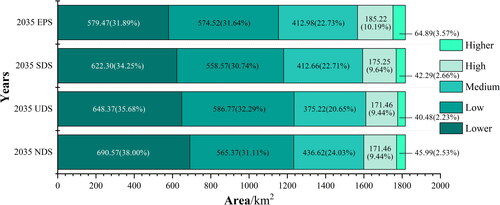
Table 10. Habitat quality index of Zhongshan city from 2000 to 2022.
Data availability statement
The data provided in this study were plotted by the authors’ team and are included in the article, which can be found in and .