
Figures & data
Figure 1. Study area along the northern Gulf of Mexico representing high marsh mapping regions (a-d) and associated watersheds. Pane e shows the full study area and the location of each region. * regions where high marsh and salt panne/flat classification models were developed. ^ regions where study-specific field data were collected. Watershed inset map and number (e.g. a1, a2, etc.). This figure is modified from Enwright et al. (Citation2023b).
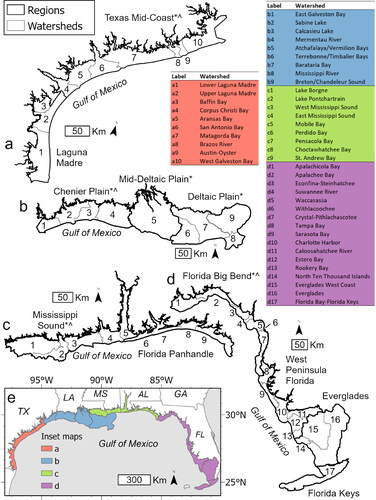
Table 1. Data sources used for mapping high marsh and salt pannes/flats along the northern Gulf of Mexico, USA.
Figure 2. Overview of the approach used for mapping high marsh and salt pannes/flats along the northern Gulf of Mexico coast, USA.
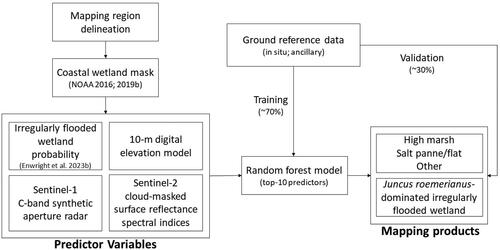
Figure 3. Examples of high marsh and salt pannes/flats along the northern Gulf of Mexico coast, USA. (a) High marsh dominated by Spartina patens (saltmeadow cordgrass) located at Cypremort State Park in South Louisiana (Photo credit: Nicholas Enwright). (b) high marsh with Distichlis spicata (saltgrass) with areas dominated by Juncus roemerianus (black needlerush; labeled as JURO) and salt panne habitat in the Florida Big Bend region (Photo credit: Heather levy).
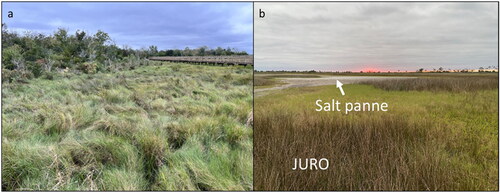
Table 2. Reference data for mapping high marsh and salt pannes/flats along the Northern Gulf of Mexico, USA.
Table 3. Spectral indices used for mapping high marsh and salt pannes/flats along the northern Gulf of Mexico coast, USA.
Figure 4. Example of high marsh and salt pannes/flats map products for the Grand Bay estuary, Mississippi, USA. (a) land cover map modified from the National Oceanic and Atmospheric Administration’s Coastal Change Analysis Program 30-m layer (NOAA 2016). (b) map of high marsh, salt pannes/flats, and other irregularly flooded wetlands. (c) map of irregularly flooded wetlands dominated by J. roemerianus. White areas in panes b and c represent areas outside the coastal wetland mask.
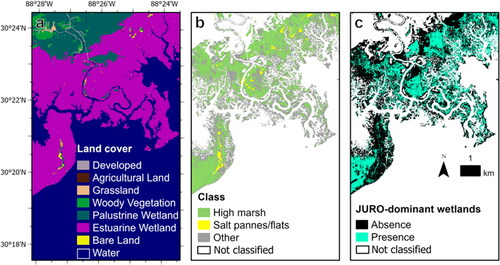
Figure 5. The top 10 predictor variables per region for mapping high marsh and salt pannes/flats along the northern Gulf of Mexico, USA. Predictor importance is proportional to unitless MeanDecreaseGini values. DEM, elevation relative to mean higher high water from the digital elevation model; GNDVI, green normalised difference vegetation index; LSWI, land surface water index; MNDWI, modified normalised difference water index; MSAVI, modified soil-adjusted vegetation index; NDVI, normalised difference vegetation index; PIF, probability irregularly flooded wetland; RENDVI, red edge normalised difference vegetation index; VH, vertical transmit/horizontal receive backscatter; VV, vertical transmit/vertical receive backscatter. Spectral indices that end in 50, 95, IQR, are the median, 95th percentile, and interquartile range, respectively.
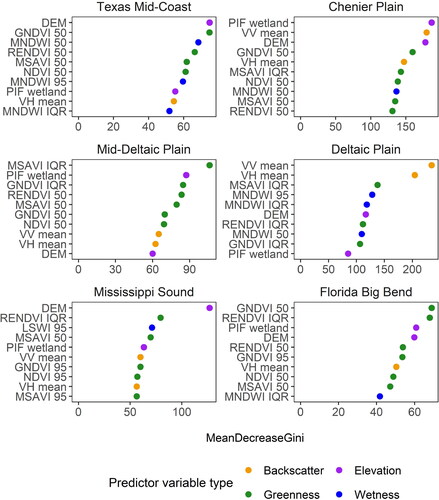
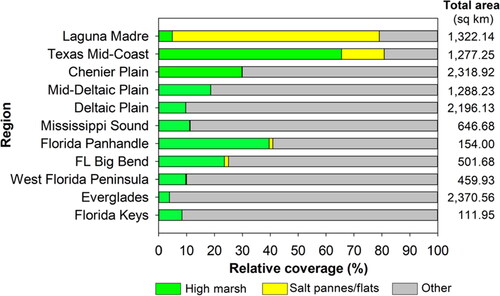
Figure 6. Relative coverage of high marsh, salt pannes/flats, other irregularly flooded wetlands by region along the northern Gulf of Mexico, USA. Other wetlands had a probability of being irregularly flooded wetland of ≥10% (Enwright et al. Citation2023b) and were not mapped as high marsh or salt panne/flat. The ‘total area’ column indicates the total area mapped as one of these three classes in square kilometers (sq km). We used sq km instead of ha here due to showing coverage at the region level. See for regional boundaries.
Supplemental Material
Download MS Word (616.7 KB)Data availability statement
Data are available as a U.S. Geological Survey data release (Enwright et al. Citation2023a).