Figures & data
Figure 1. Location map of the study area (a) India, (b) West Bengal, and (c) Malda district.
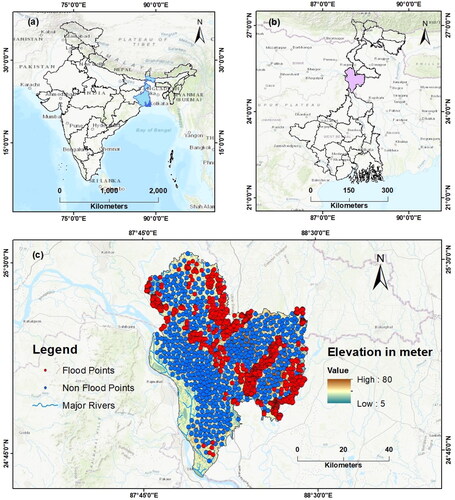
Table 1. Flood-affected areas of the Malda district based on DDMPM (2020-2021).
Figure 2. Methodological flowchart of the flood risk assessment.
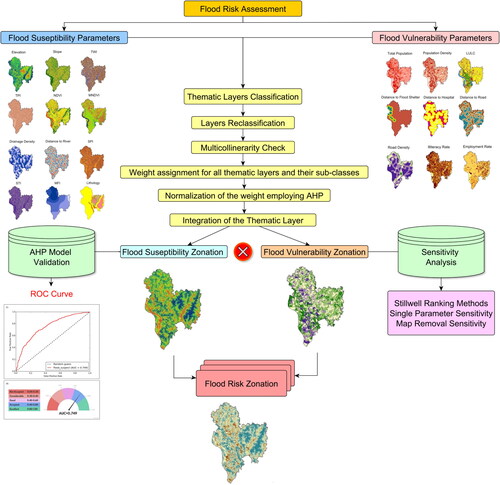
Figure 3. Flood susceptibility conditioning parameters of the Malda district: (a) elevation, (b) slope, (c) Topographical wetness index (TWI), (d) Topographical positioning index (TPI), (e) normalized difference vegetation index (NDVI), (f) modified normalized difference water index (MNDWI), (g) drainage density, (h) distance to river, (i) Stream power index (SPI), (j) modified fourier index (MFI) and (k) lithology.
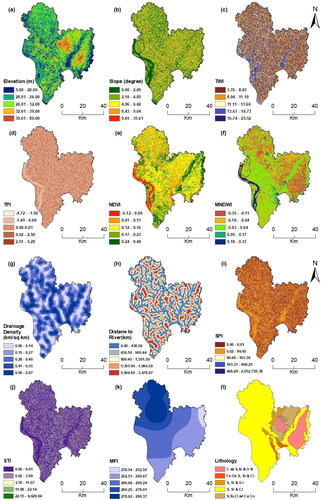
Figure 4. Pearson Correlational Matrix among the different flood susceptibility parameters.
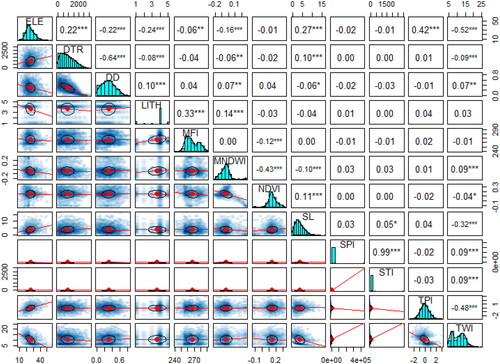
Figure 5. Flood vulnerability conditioning parameters of the Malda district: (a)total population, (b) population density, (c) land use land cover (LULC), (d) distance to flood shelter, (e) distance to hospital, (f) distance to road, (g) road density, (h) illiteracy rate and (i) employment rate.
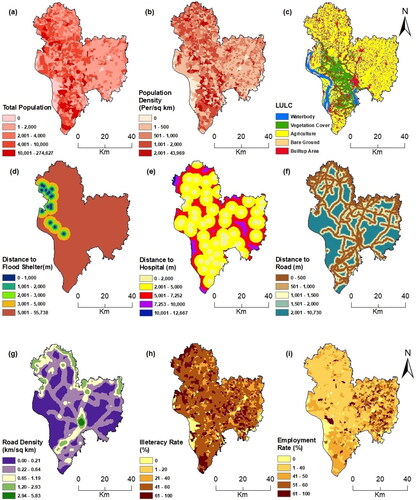
Figure 6. Pearson Correlational Matrix among the different flood vulnerability parameters.
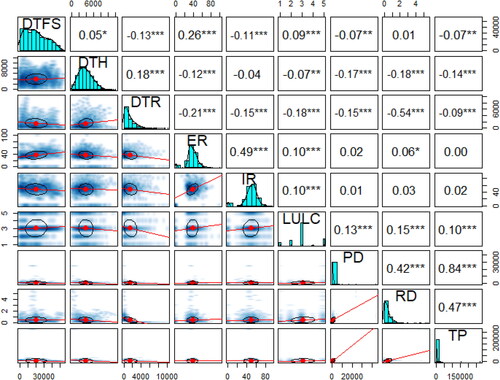
Table 2. Source and description of the parameters used in susceptibility and vulnerability zonation.
Table 3. Saaty’s scale of relative importance.
Table 4. Random index (RI) to check the consistency ratio for different matrices (Saaty and Vargas Citation1991).
Table 5. Multicollinearity Statistics of flood susceptibility and vulnerability parameters.
Table 6. Multi-collinearity diagnosis of flood susceptibility and vulnerability parameters.
Figure 7. (a) Flood susceptibility zonation, (b) flood vulnerability zonation, and (c) flood risk zonation map of Malda district.
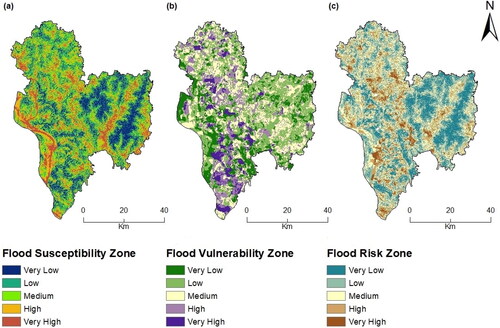
Table 7. AHP Table for flood susceptibility Zone analysis.
Table 8. Consistency check of aggregated for flood hazard in the Malda district.
Table 9. AHP Table for flood vulnerability Zone analysis.
Table 10. Consistency check of aggregated for flood hazard in the Malda district.
Table 11. Area of flood susceptibility, vulnerability, and risk zonation of Malda district, WB.
Table 12. Comparison of weightage using different methods for flood susceptibility zonation.
Table 13. Comparison of weightage using different methods for flood vulnerability zonation.
Figure 8. Effective weight (W) for flood susceptibility parameters.
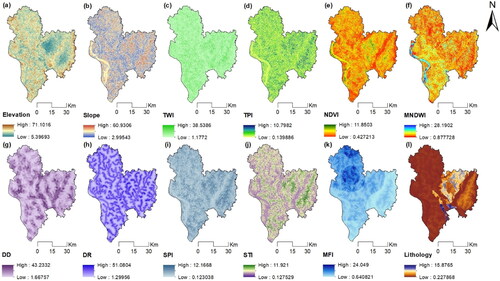
Table 14. Descriptive Statistics of single parameter sensitivity analysis of flood susceptibility.
Figure 9. Effective weight (W) for flood vulnerability parameters.
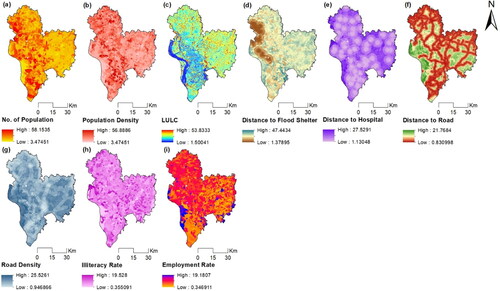
Table 15. Descriptive Statistics of single parameter sensitivity analysis of flood vulnerability.
Figure 10. Sensitivity index (SI) for flood susceptibility parameters.
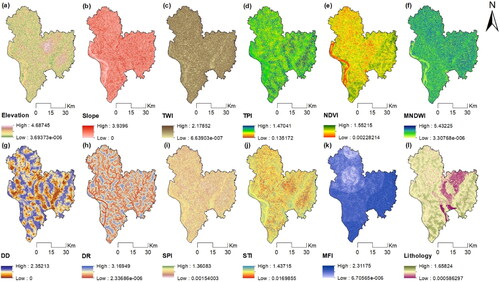
Figure 11. Flood susceptibility zonation with each parameter removal.
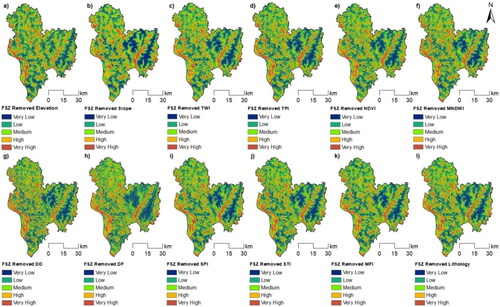
Table 16. Descriptive Statistics of map removal sensitivity analysis of flood susceptibility.
Table 17. Percentage of changes of flood susceptibility zonation with the removal of each thematic layer.
Figure 12. Sensitivity index (SI) for flood vulnerability parameters.
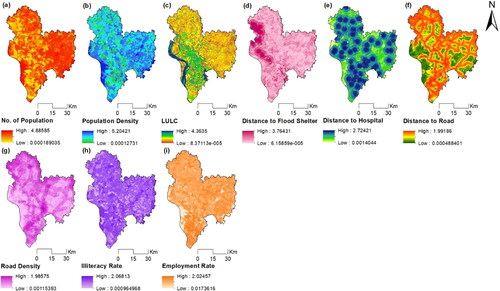
Figure 13. Flood vulnerability zonation with each parameter removal.
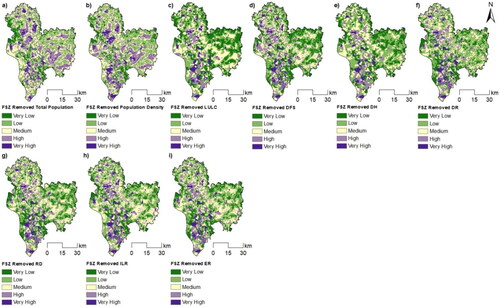
Table 18. Descriptive Statistics of map removal sensitivity analysis of flood vulnerability.
Table 19. Percentage of changes of flood vulnerability zonation with removal of each thematic layer.
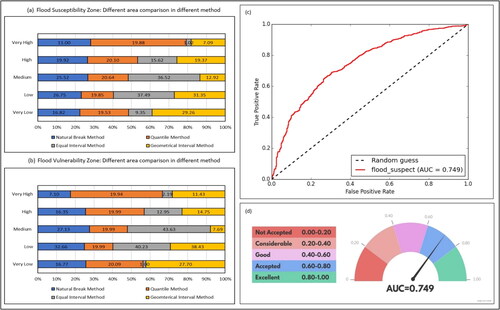
Figure 14. (a) Classification of flood susceptibility zonation, (b) flood vulnerability zonation, (c) ROC-AUC analysis, (d) speedometer shows the AUC.