
Figures & data
Figure 1. Distribution of forest fire points in China, 2001–2020.
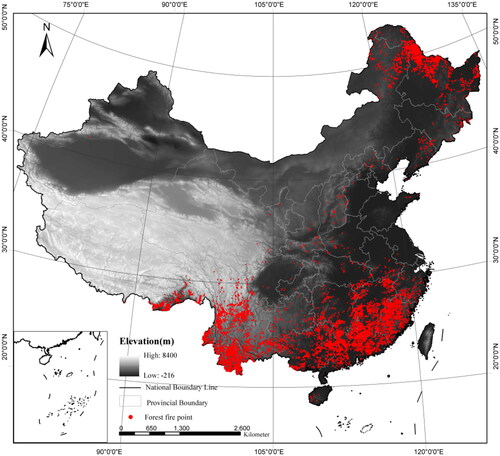
Figure 2. Risk factors of forest fires ((a) Night light image of China in 2020, (b) 20-20 h precipitation distribution graph of China on March 30, 2020, (c) Average temperature distribution graph of China on March 30, 2020, (d) Average relative humidity distribution graph of China on March 30, 2020, (e) Average wind speed distribution graph of China on March 30, 2020, (f) Elevation distribution graph of China, (g) Slope distribution graph of China in (h) Distribution of slope direction in China, (i) Distribution of NDVI in China on March 30,2020, and (j) Distribution of NMDI in China on March 30, 2020).
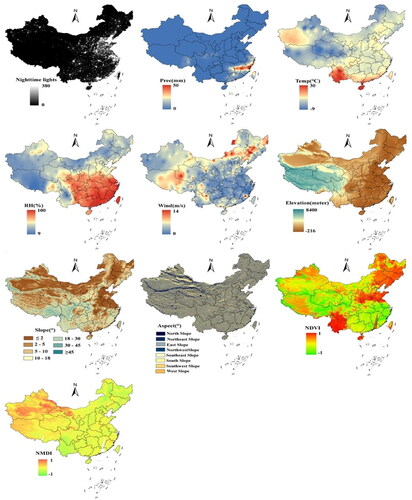
Table 1. Risk factors of forest fire.
Figure 3. Spatial and temporal distribution of forest fires in China.
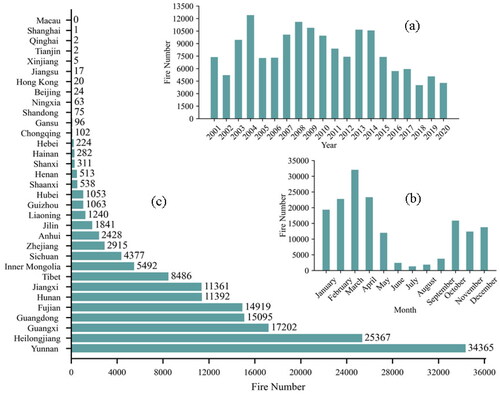
Figure 4. K function results for 2001-2020 (red line represents ObservedK, blue indicates ExpectedK, purple represents HiConfEnv, green represents LwConfEnv (ripley’s K tool outputs the values of Expected K, LwConfEnv, HiConfEnv, observed K, etc. If the observed K is greater than Expected K and observed K is greater than LwConfEnv, the point data at that distance display the remarkable clustering feature. If the Observation K is smaller than the expectation K and the Observation K is smaller than HiConfEnv, the point data spatial distribution is significantly discreet)).
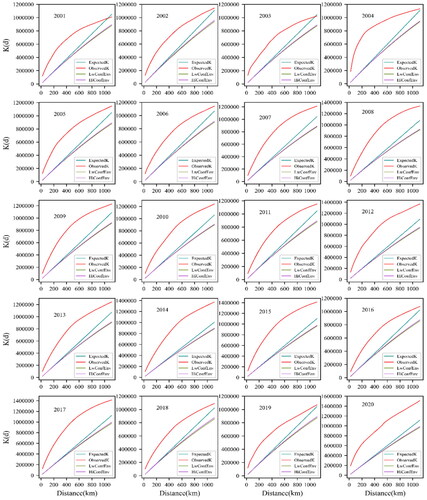
Figure 5. Descriptive statistics of risk factors in forest fire data from 2001 to 2020.
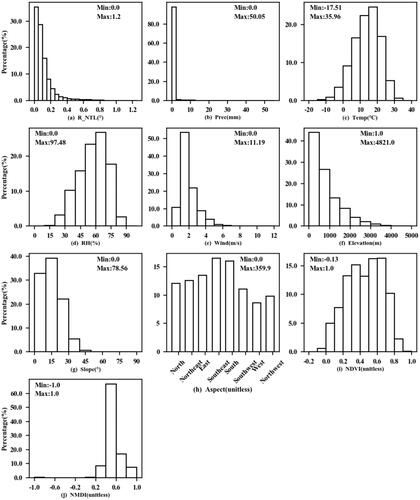
Figure 6. Ranking of driving factors importance.
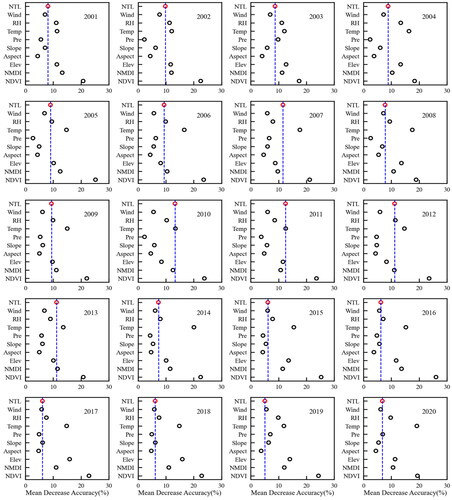
Figure 7. ROC curves (red indicates ROC curves for LR, blue indicates ROC curves for RF_NTL, and yellow indicates ROC curves for RF).
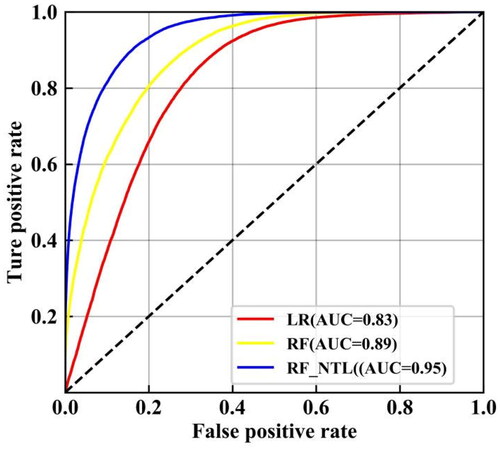
Table 2. Model performance.
Figure 8. Evaluation of RF_NTL based on a monthly scale.
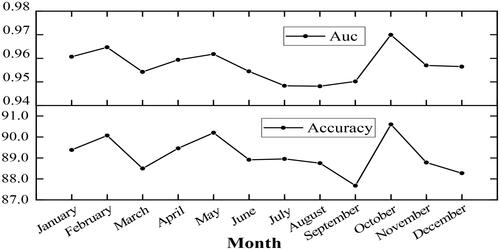
Figure 9. Evaluation of RF_NTL based on an annual scale.
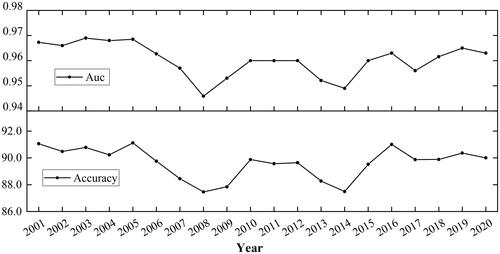
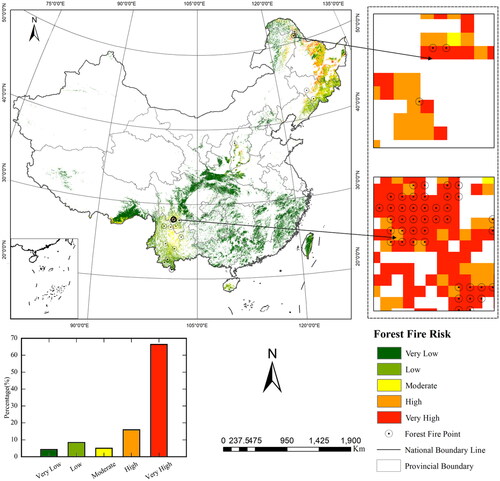
Figure 10. Spatial distribution of forest fire risk in China.
Data availability statement
The data that support the findings of this study are available from the corresponding author, ZZ, upon reasonable request.