
Figures & data
Figure 1. (A) Location of the federal state of Hesse in Central Germany and (B) the CORINE Land cover map from 2018 (CLC Citation2018).
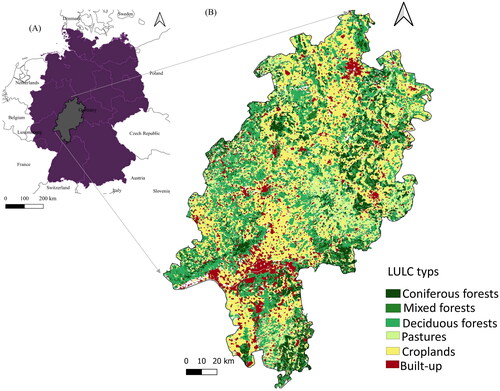
Figure 2. Variation of monthly drought index after de Martonne from 2014 to 2021 in Hesse/Germany (CDC Citation2022). maximum variation and drought happened in 2018.
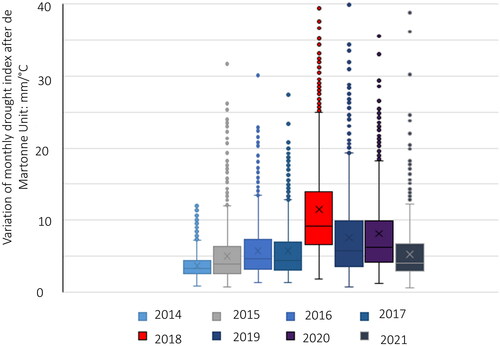
Figure 3. Conceptual framework of the study. The green box contains all input data and their categories. The grey boxes show the methodological steps and analysis to reach the target in the yellow box.
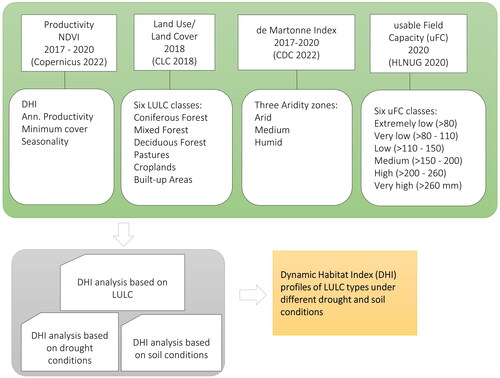
Table 1. Overview of the different usable field capacity (uFC) categories and the proportional areas in Hesse based on data by HLNUG_BFD(50 2020).
Figure 4. The combined components of the dynamic habitat index derived from 2017 to 2020 (a). this composite image was developed by assigning the annual productivity to the red band, the minimum cover to the green band and the seasonality to the blue band. Blue areas have low annual productivity, low minimum cover and high seasonal variability. Thus, blue areas indicate the locations of the built-up areas. Bright yellow areas have a high annual productivity, a high minimum cover and low variability and represent locations with coniferous forests that were consistently green throughout the year. Purple areas or pastures indicate landscapes with medium annual productivity, medium minimum cover and low variability. Green areas or croplands indicate moderate landscape greenness that varies throughout the year. Red areas or deciduous forest have high annual production, moderate minimum cover and high seasonality. Black points on the map refer to the example areas (B) the three-dimensional scatterplot indicates three components of the DHI. The areas with high seasonality have lower annual productivity and minimum cover than the areas with low seasonality.
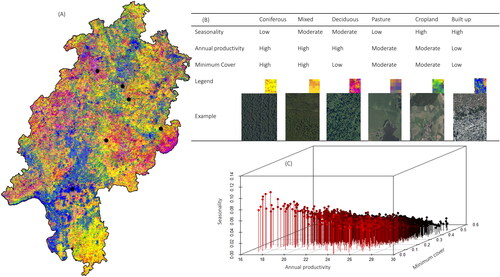
Figure 5. Cumulative annual productivity (DHICum) from 2017 to 2020 including the severe drought year 2018 for the six main Land use/Land Cover types in Hesse, Germany, namely, coniferous, mixed and deciduous forests, pastures, croplands and built-up areas. The black line connects the median of annual productivity. Small letters on the columns indicate significant differences in values based on one-way analysis of variance (ANOVA) and the Tukey post hoc test.
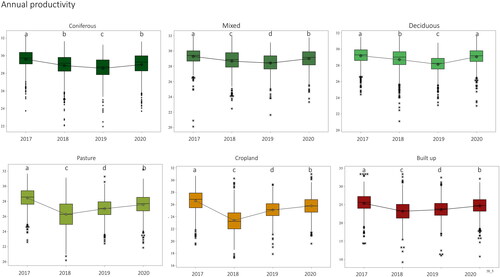
Figure 6. Minimum cover (DHIMin) from 2017 to 2020 including the severe drought year 2018 for the six main Land use/Land Cover types in Hesse, Germany, namely, coniferous, mixed and deciduous forests, pastures, croplands and built-up areas. The black line connects the medians of minimum cover. Small letters on the columns indicate significant differences in values based on one-way analysis of variance (ANOVA) and the Tukey post hoc test.
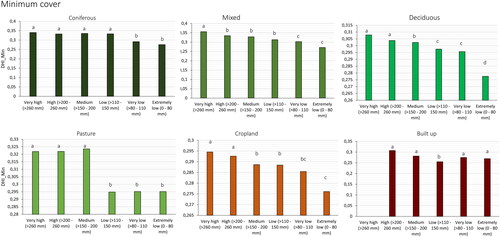
Figure 7. Seasonality (DHIVar) from 2017 to 2020 including the severe drought year 2018 for the six main Land use/Land Cover types in Hesse, Germany, namely, coniferous, mixed and deciduous forests, pastures, croplands and built-up areas. The black line connects the medians of seasonality. Small letters on the columns indicate significant differences in values based on one-way analysis of variance (ANOVA) and the Tukey post hoc test.
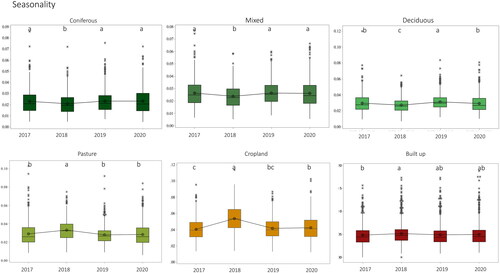
Figure 8. The three components of the Dynamic Habitat Index (DHI), namely (A) DHICum (annual productivity), (B) DHIMin (minimum cover) and (C) DHIVar (seasonality) based on NDVI data from 2017 to 2020 are shown for six LULC types (coniferous, mixed and deciduous forests, pastures, croplands and built-up areas) and three aridity zones. The orange columns represent the arid zone, the yellow columns represent the medium zone, and the green columns represent the humid zone. The capital letter above the graph indicates the significance of the comparisons within each aridity zone separately, and the small letters inside the graph indicate the significance of the comparisons within each LULC type (p value <.05).
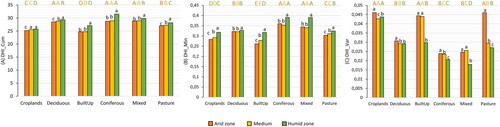
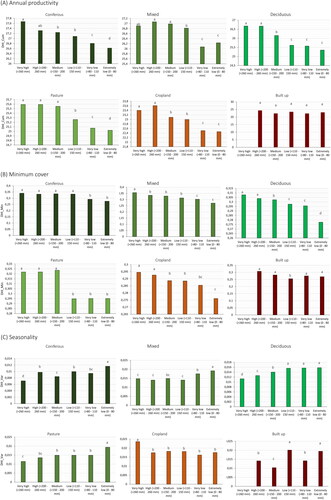
Figure 9. (A) Annual productivity (DHICum), (B) minimum cover (DHImin) and (C) seasonality (DHIVar) of each LULC type (namely, coniferous, mixed and deciduous forests, pastures, croplands and built-up areas) depending on the usable field capacity (uFC). Small letters on the columns indicate significant differences between uFC classes (p value < .05).
Data availability statement
Data are available on request from the authors.