
Figures & data
Figure 1. The framework of SBHSR network.
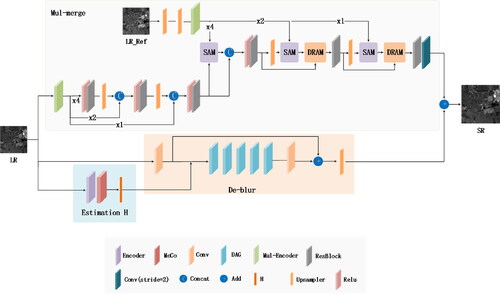
Figure 2. Estimation H moudule structure.
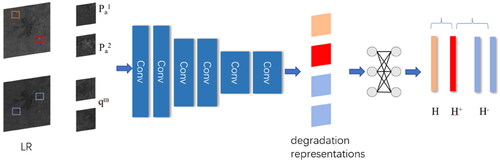
Figure 3. Mul-Encoder structure.
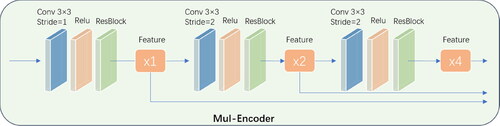
Figure 4. DRAM structure.
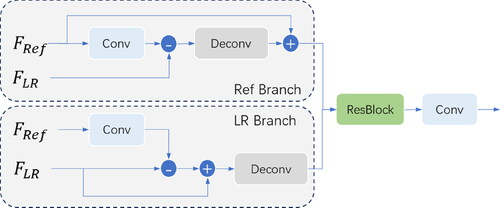
Figure 5. SAM structure.
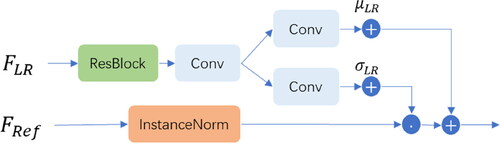
Figure 6. ResBlock structure.
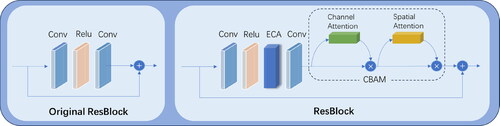
Figure 7. Comparison of three sets (a–c) of grayscale image details for the 55th band reconstructed from Pavia-Center data.
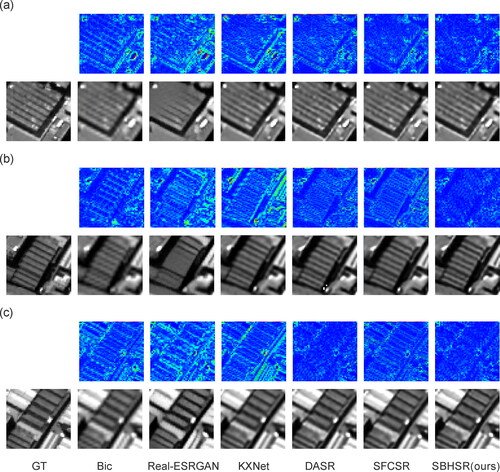
Figure 8. The detailed image of the 55th band of Pavia-Center data.
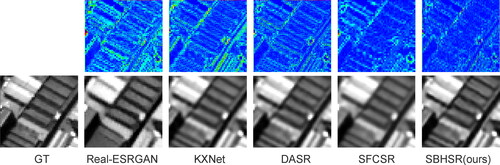
Figure 9. Details of the doubled super-resolution (a) (b) of 12th band in the original image of OHS data.
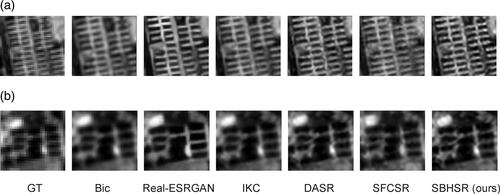
Table 1. Quantitative evaluation Pavia-Center dataset.
Table 2. The no-reference image evaluation metrics.
Figure 10. Absolute error maps of the reconstructed hyperspectral images.
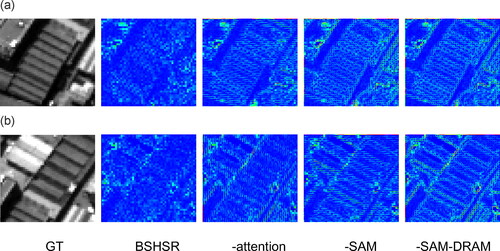
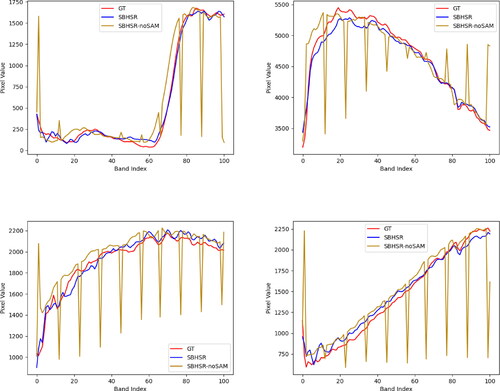
Figure 11. Spectral curve comparison chart.
Data availability statement
Some or all data, models, or code generated or used during the study are available from the corresponding author by request.